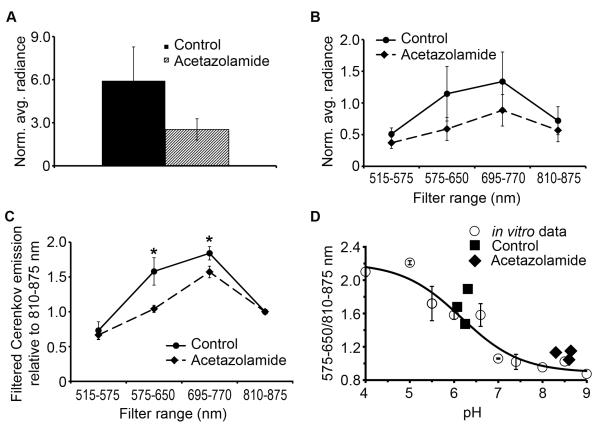
Figure 5. Quantification of in vivo Cerenkov images.
Average radiance from the bladder using (A) open filter, (B) the 4 selective filters, (C) the ratio of emission at each filter relative to 810-875 nm. * significant, p<0.05, Students t-test, (D) Ratiometric pH determination. Open circles depict the ratio of Cerenkov emission at (575-650 nm)/(810-875 nm) for in vitro 18F-MFCP (data from Figure 2C). The solid line is a fit to a sigmoidal curve and gives a pKa of 6.25, similar to 6.4 determined by the open filter data. Black diamonds and squares represent Cerenkov emission from control and acetazolamide-treated mice plotted against actual urine pH.

