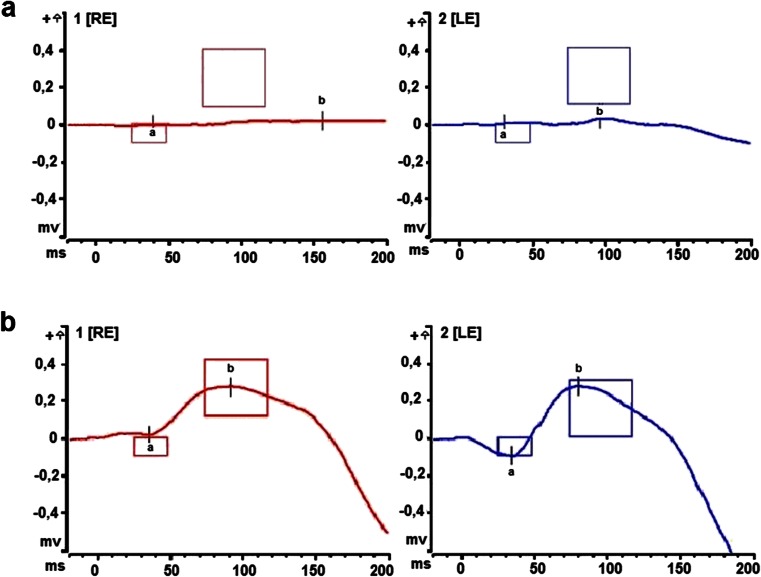
Fig. 4.
Comparison of scotopic responses after 30 and 120 min of dark adaptation: RE, right eye; LE, left eye. a The reduction of scotopic responses (DA 0.009 cdxs/m2) (b-wave amplitude RE: 26.68 μV, LE: 26.53 μV, normal 260 ± 151.4 μV), standard electroretinography (ERG) response (3 cdxs/m2) on the borderline after 30 min of dark adaptation. b The normalisation of scotopic responses after 120 min of scotopic adaptation (b-wave amplitude RE: 259.1 μV, LE: 378.2 μV)

