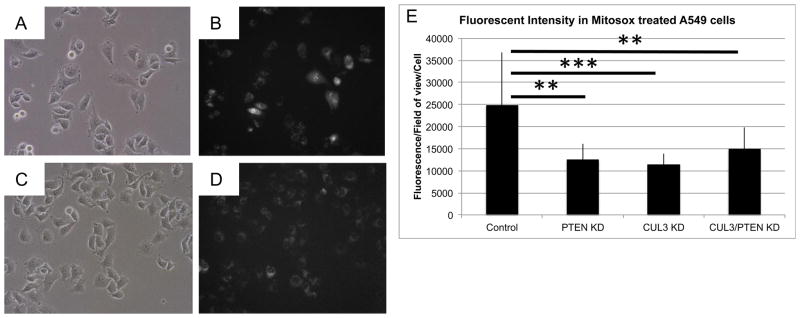
Figure 6. Knockdown of CUL3 and PTEN results in decreased levels of superoxide.
Knockdown of CUL3 and/or PTEN in A549 cells results in reduced superoxide production. Representative brightfield (left) and red fluorescent (right, converted to grayscale) images of (A, B) A549 control cells and (C,D) A549 CUL3/PTEN knockdown cells treated with MitoSox. E) Graph of average MitoSox fluorescence/field of view/cell comparing control cells to PTEN, CUL3, and CUL3/PTEN knockdown A549 cells.

