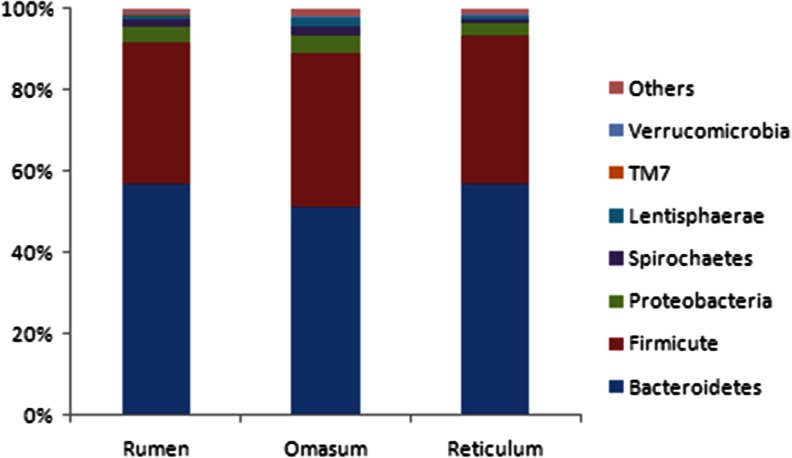
Fig. 2.
The relative distribution of the seven most abundant phyla in the three stomachs. The percentage of the 16S V3 sequences assigned to a given phylum is represented by the color-coded bars. The seven most abundant phyla representing more than 98 % of the bacteria identified in the three samples are presented separately, whereas the remaining phyla are indicated as “others”

