Fig. 5.

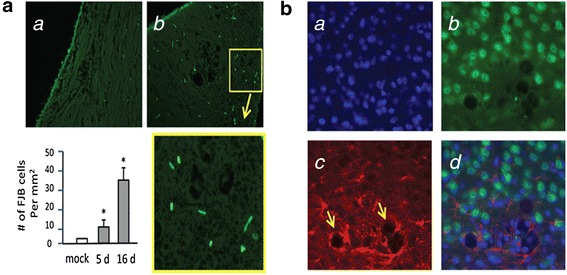
Neuronal damages of Cn infected brains that contain prefrontal cortex. (a) The FJB signals of the control (a) and Cn-infected mouse brain sections (5 day infection) (b) are shown. The yellow box is magnified shown in below. Mean number of FJB positive neurons/mm2 (n = 5) at 5- and 16- days are significantly different from the mock control (*P < 0.05). (b) A Cn-infected brain section shows (a) nuclear DNA (DAPI stain), (b) neuron cells (NeuN), (c) reactive astrocytes (GFAP), and (d) the overlaid image. The upper part of the image seems normal, but the lower part shows that the reactive astrocytes surrounding the cystic lesions (yellow arrows), where the NeuN signals disappear near the lesions. Similar observations were obtained from gp41-I90 treatment, but the signals were more dispersed through the whole brain section (data not shown)
