
Fig. 1.
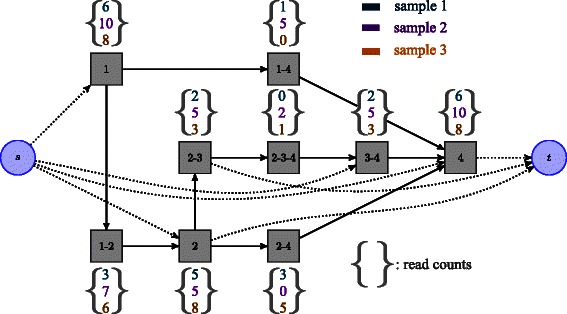
Multi-dimensional splicing graph with three samples. Each candidate isoform is a path from source node s to sink node t. Nodes denoted as grey squares correspond to ordered set of exons. Each read is assigned to a unique node, corresponding to the exact set of exons that it overlaps. Note that more than 2 exons can constitute a node, properly modeling reads spanning more than 2 exons. A vector of read counts (one component per sample) is then associated to each node of the graph. Note also that some components of a vector can be equal to zero