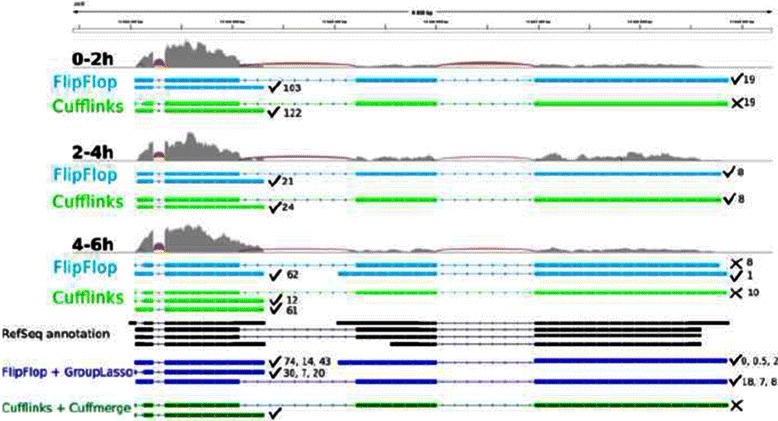
Fig. 6.

Transcriptome predictions of gene CG15717 from 3 samples of the modENCODE data. Samples name are 0–2 h, 2–4 h and 4–6 h. Each sample track contains the read coverage (light grey) and junction reads (red) as well as FlipFlop predictions (light blue) and Cufflinks predictions (light green). The bottom of the figure displays the RefSeq records (black) and the multi-sample predictions of the group-lasso (dark blue) and of Cufflinks/Cuffmerge (dark green)
