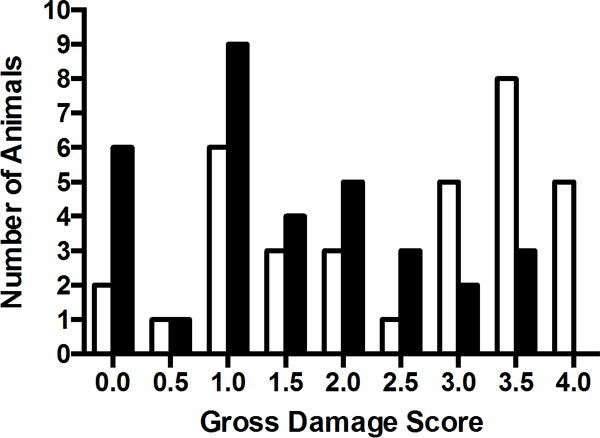
Figure 2. Effect of TH at 2 weeks.

DS was assessed in all animals from T2 images demonstrating more animals with lower DS following TH (black bars) relative to normothermic (white bars) recovery.

DS was assessed in all animals from T2 images demonstrating more animals with lower DS following TH (black bars) relative to normothermic (white bars) recovery.