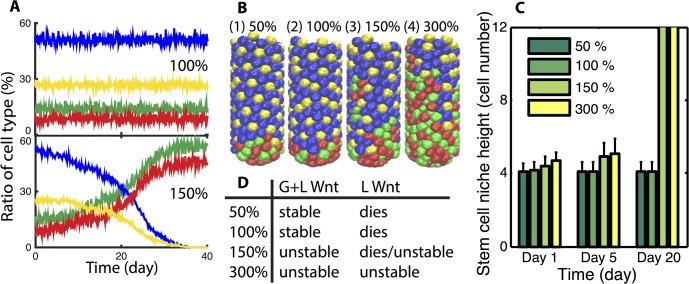
Fig 2. Additional local Wnt production by Paneth cells leads to stem cell niche expansion.
Panel A) Ratio of each cell type of a typical crypt when local Wnt production capability is 100% and 150% for each Paneth cell, respectively. Color code for Panel A and Panel B: stem cell (red), Paneth cell (green), enterocytes (blue) and Goblet cell (yellow). Panel B) Snapshots of crypts at day 10 for different local Wnt production levels. Panel C) Plot of niche height as a function of different Wnt production rates at multiple times. Mean and standard deviation of an ensemble of 10 simulations is reported. Cases where the bar extends to the top indicate the niche is unstable and expands to occupy the entire crypt. Panel D) Indication of how the global and local Wnt influence the broad dynamics of the niche. Left column indicates the local Wnt production rates considered. G+L indicates that both global and local, Paneth cell derived Wnt are included while the right (L) column considers the setting where the global Wnt gradient is removed. “Stable” indicates a properly structured, steady state crypt results, “dies” indicates the niche (stem and Paneth cells) is completely lost, while “unstable” indicates the niche undergoes uncontrolled expansion. In no scenario is the niche stable both before and after the removal of the Wnt gradient, indicating in this setting Paneth cell derived Wnt cannot act redundantly.

