
Figure 6.
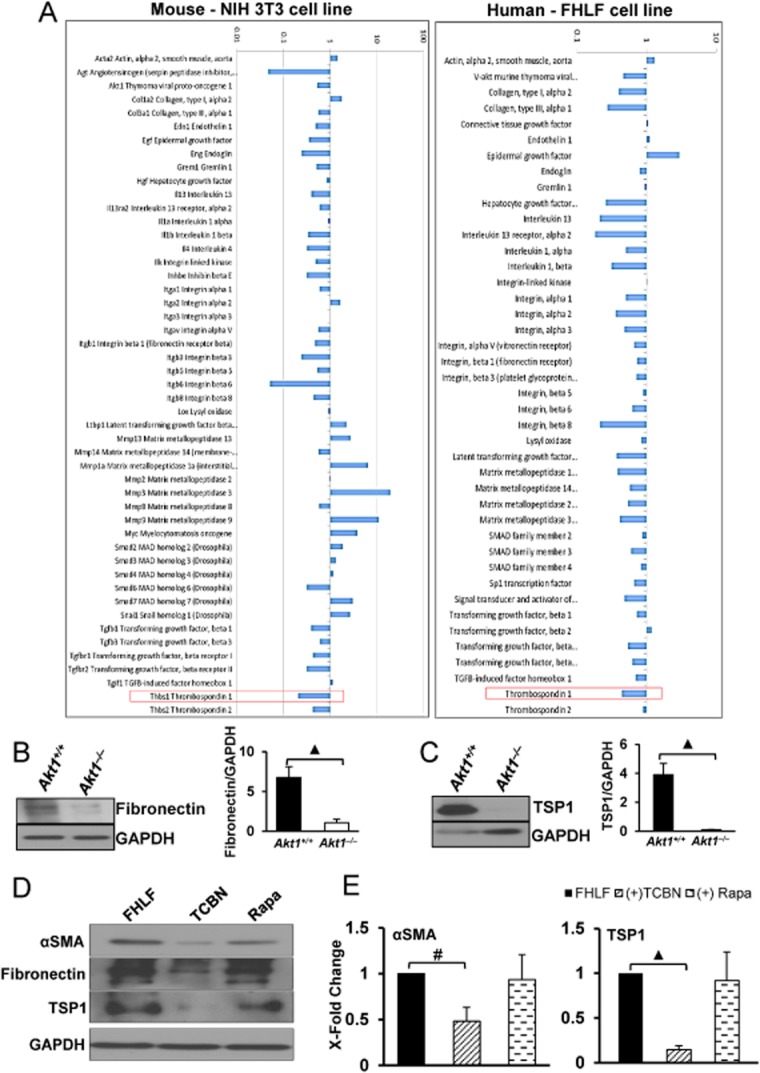
TSP1 expression is decreased in Akt1-deficient NIH 3T3, IPF fibroblasts and 14 day hypoxic mice. (A) Gene expression profiles of NIH 3T3 and IPF fibroblasts (FHLFs) expressing DN-Akt1 (dominant negative, inactive Akt1) (n = 3). (B and C) Western blot image and histogram showing total fibronectin and TSP1 expression levels normalized to GAPDH levels in 14 day hypoxic Akt1+/+ and Akt1−/− mice lungs (n = 3–5 per group). (D) Images of Western blots showing the effect of TCBN and rapamycin on the expression of αSMA and TSP1 expression in FHLFs. (E) Histogram showing densitometry analysis of the Western blot bands indicating changes in the expression levels of αSMA and TSP1, normalized to GAPDH after treatment with TCBN and rapamycin in FHLFs (n = 3). #P < 0.01, ▲P < 0.001.