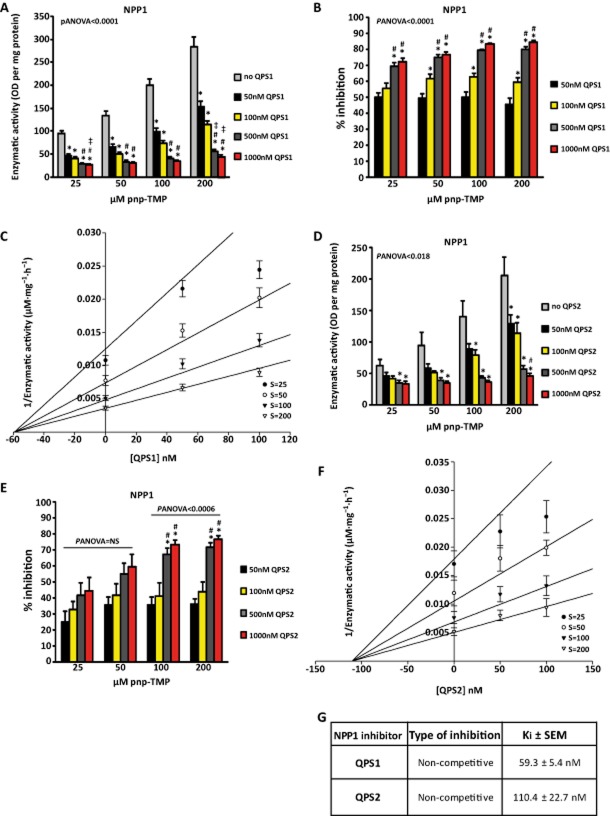
Figure 2.
Inhibition of NPP1 by QPS1 (A and B; n = 5) and Dixon plot representation (C). Inhibition of NPP1 by QPS2 (D and E; n = 4) and Dixon plot representation (F). G) Characteristics of inhibition by QPS1 and QPS2. S: substrate. Data are mean ± SEM. *P < 0.05 compared with control (no QPS); #P < 0.05 compared with 50 nM dose; ‡P < 0.05 compared with 100 nM dose.

