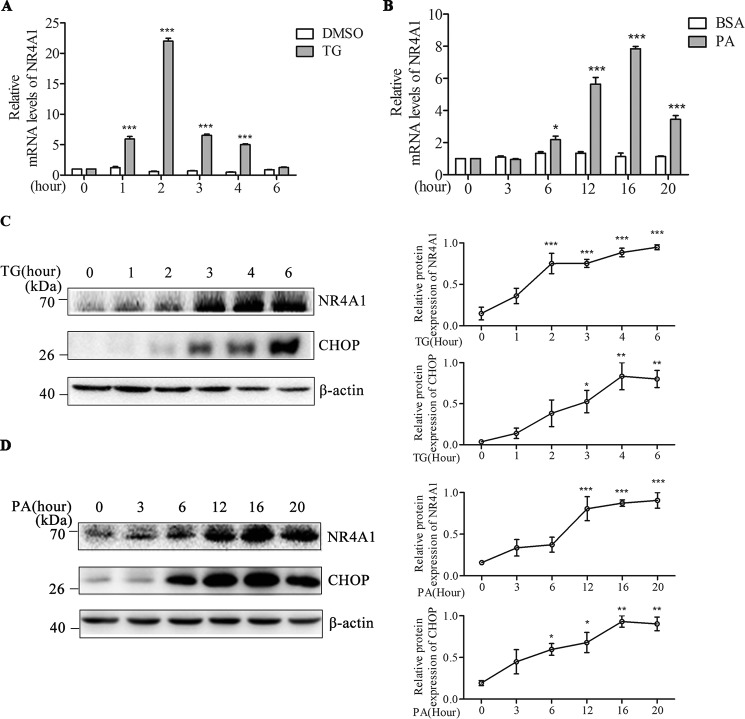
FIGURE 1.
Analysis of the effect of TG or PA on NR4A1 expression in MIN6 cells. A and B, relative NR4A1 mRNA levels in response to 0.5 μm TG (A) (DMSO as control) or 0.4 mm PA (B) (BSA as control) at various time points, as determined by qPCR. C and D, protein expression of NR4A1 and CHOP in response to 0.5 μm TG (C) and 0.4 mm PA (D) at various time points, assessed by Western blotting. Densitometric analyses of the blots are shown as curves. The data show the means of three independent experiments, *p < 0.05, ***p < 0.001 versus the DMSO or BSA control.

