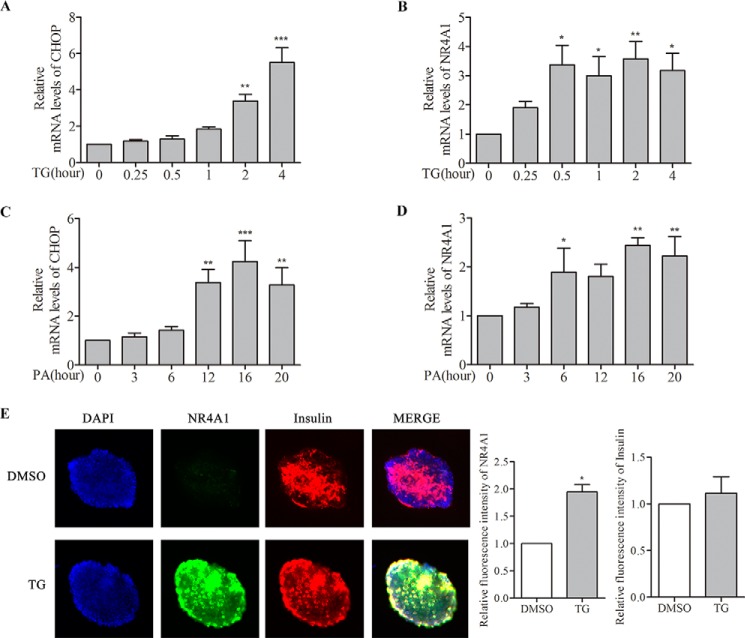
FIGURE 2.
Analysis of the effect of TG or PA on NR4A1 expression in mouse islets. Mouse islets were isolated from C57BL/6J mice, and total RNA of mouse islets was prepared using an RNeasy Mini Kit. A–D, relative mRNA levels of CHOP and NR4A1 in response to 0.5 μm TG (A and B) or 0.4 mm PA (C and D) at various time points were determined by qPCR. E, determination of the induced NR4A1 expression in pancreatic β-cells upon TG or PA treatment. Mouse islets were treated with 0.5 μm TG for 6 h, and double immunofluorescence staining was performed with anti-insulin and anti-NR4A1 antibodies from different species. The top panel is an islet treated with DMSO as a control, and the lower panel is an islet treated with TG. Blue represents DAPI, green represents NR4A1, red represents insulin, and MERGE of the three colors. The histograms indicate relative fluorescence intensity (=total red densitometry value/islet surface area). The data show the means of three independent experiments, *, p < 0.05; **, p < 0.01; ***, p < 0.001 versus 0 h or DMSO control.

