FIGURE 7.

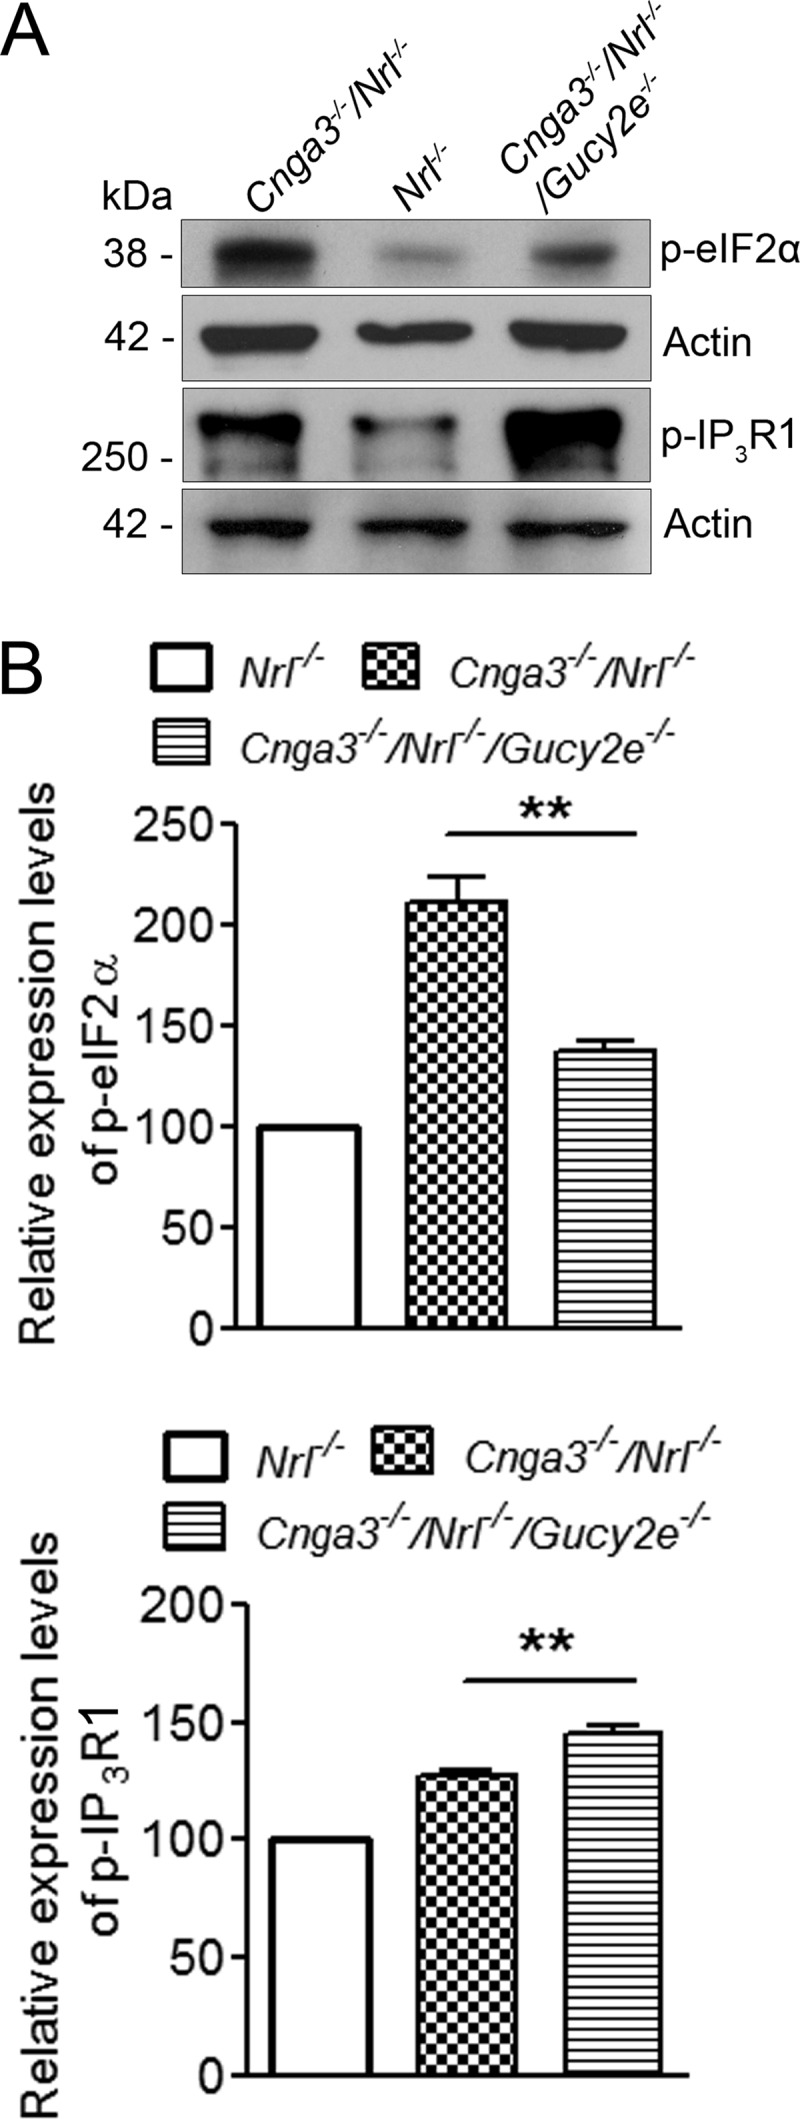
Reduced levels of phospho-eIF2α and increased levels of phospho-IP3R1 in Cnga3−/−/Nrl−/−/Gucy2e−/− retinas. Shown are representative images of the Western blot detection of phospho-eIF2α and phospho-IP3R1 in retinas of Cnga3−/−/Nrl−/−/Gucy2e−/−, Cnga3−/−/Nrl−/−, and Nrl−/− mice at P30 (A) and the corresponding densitometric analysis (B). The relative expression levels in Cnga3−/−/Nrl−/− and Cnga3−/−/Nrl−/−/Gucy2e−/−mice were normalized to the values in Nrl−/− mice. Data are represented as means ± S.E. of measurements from 3 to 4 assays using retinas prepared from 4 to 5 mice. Unpaired Student's t test was used for determination of the significance of differences between the drug-treated and vehicle-treated mice (**, p < 0.01).
