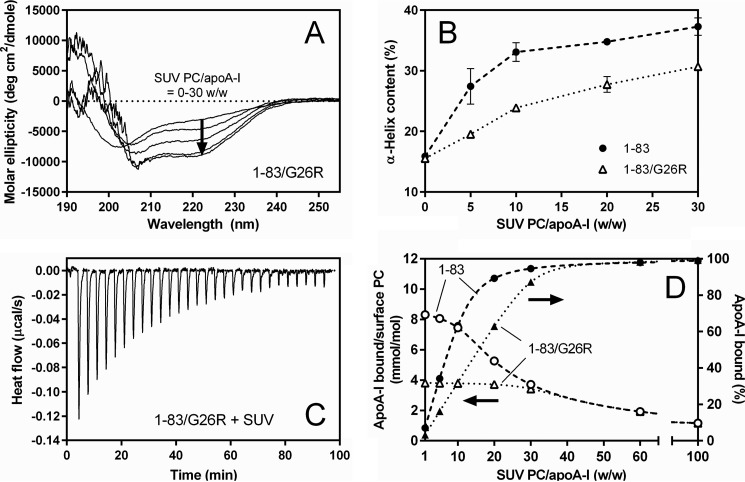
FIGURE 2.
Comparison of binding behaviors of apoA-I 1–83 variants to egg PC SUV. A, far-UV CD spectra of apoA-I 1–83/G26R bound to egg PC SUV. The protein concentration was 50 μg/ml. B, increases in α-helix content of apoA-I 1–83 (●) and 1–83/G26R (Δ) as a function of the weight ratio of PC to apoA-I. C, isothermal titration thermogram for binding of apoA-I 1–83/G26R to egg PC SUV. D, changes in the fraction % of apoA-I bound to SUV (● and ▴) and molar ratio of bound apoA-I to PC on the SUV surface (○ and Δ) for apoA-I 1–83 (dashed line) and 1–83/G26R (dotted line) with increasing weight ratio of PC to apoA-I. Fraction % of apoA-I bound to SUV were derived from Kd and Bmax values. Molar ratios of bound apoA-I to PC on the SUV surface were derived assuming that surface PC is located on the outer leaflet of SUV available for apoA-I binding is 67% of total PC.

