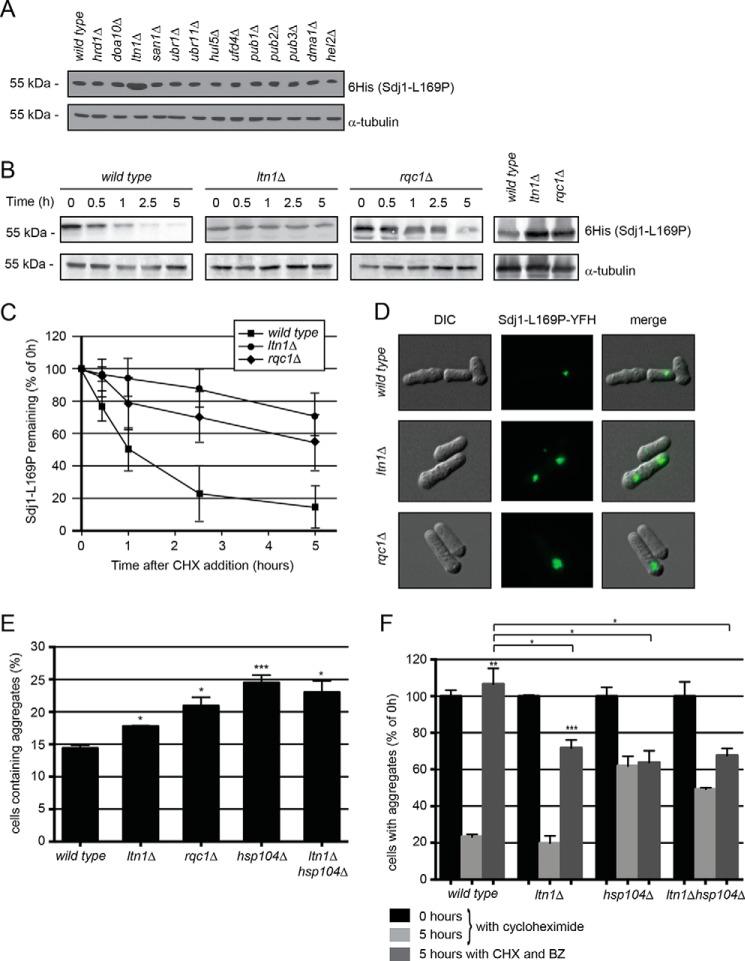
FIGURE 5.
The E3 Ltn1 targets nascent Sdj1-L169P for degradation. A, the steady-state level of Sdj1-L169P-YFH in the indicated strains was determined by Western blotting of whole cell lysates. Tubulin served as a loading control. B, the amount of Sdj1-L169P-YFH was followed in the wild type, ltn1Δ, and rqc1Δ strains treated with cycloheximide (CHX). Equal loading was checked using antibodies to tubulin. C, quantification of degradation experiments as in B. Wild type, filled square; ltn1Δ, filled circle; rqc1Δ, filled diamond. The error bars indicate the S.E. ± mean (n = 4). D, fluorescence micrographs showing the Sdj1-L169P containing aggregates in the indicated genetic backgrounds. Note the larger aggregates in the ltn1Δ and rqc1Δ strains. E, the number of the Sdj1-L169P-YFH aggregate containing cells was determined by fluorescence microscopy for the indicated strains. The error bars indicate the S.E. ± mean (n = 3, *, p > 0.5; ***, p < 0.001, Student's t test). F, the stability of Sdj1-L169P aggregates in the indicated strains was determined by counting the number of cells containing aggregates in cultures treated with cycloheximide. To some cultures (dark gray) the proteasome inhibitor bortezomib (BZ) was also added. The number of aggregate containing cells at 0 h was normalized to 100%. The error bars indicate the S.E. ± mean (n = 3, **, p < 0.01, Student's t test). Before normalization the data were: wild type (0 h), 14.38 ± 0.47 (S.E.); wild type (5 h), 3.35 ± 0.18; wild type + BZ (5 h), 15.32 ± 1.24; ltn1Δ (0 h), 17.77 ± 0.10 (S.E.); ltn1Δ (5 h), 3.52 ± 0.70; ltn1Δ + BZ (5 h), 12.74 ± 0.78; hsp104Δ (0 h), 24.49 ± 1.18; hsp104Δ (5 h), 15.15 ± 1.28; hsp104Δ + BZ (5 h), 15.62 ± 1.56; ltn1Δhsp104Δ (0 h), 23.01 ± 1.79; ltn1Δhsp104Δ (5 h), 11.33 ± 0.19; ltn1Δhsp104Δ + BZ (5 h), 15.54 ± 0.91.

