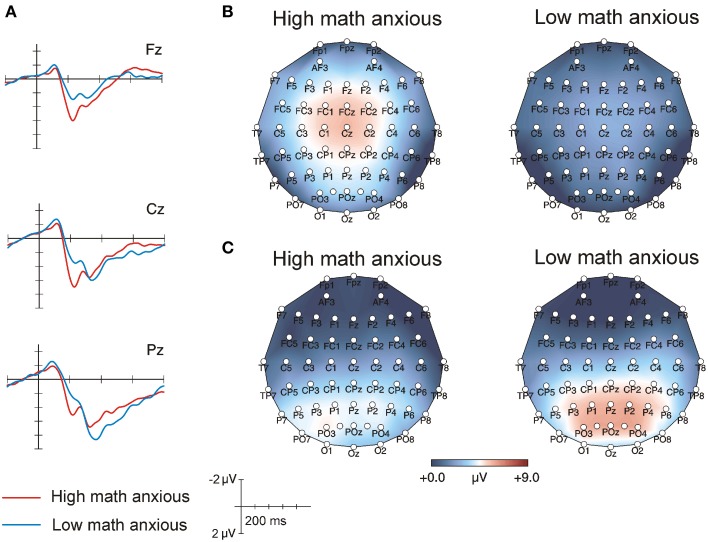
Figure 2.
(A) Raw averaged waveforms for HMA (n = 17) and LMA (n = 17) individuals during the verification phase when correct solutions were presented. (B) Topographic maps for HMA and LMA individuals in the 175–225 ms window of the verification phase. (C) Topographic maps for HMA and LMA individuals in the 400–600 ms window of the verification phase.

