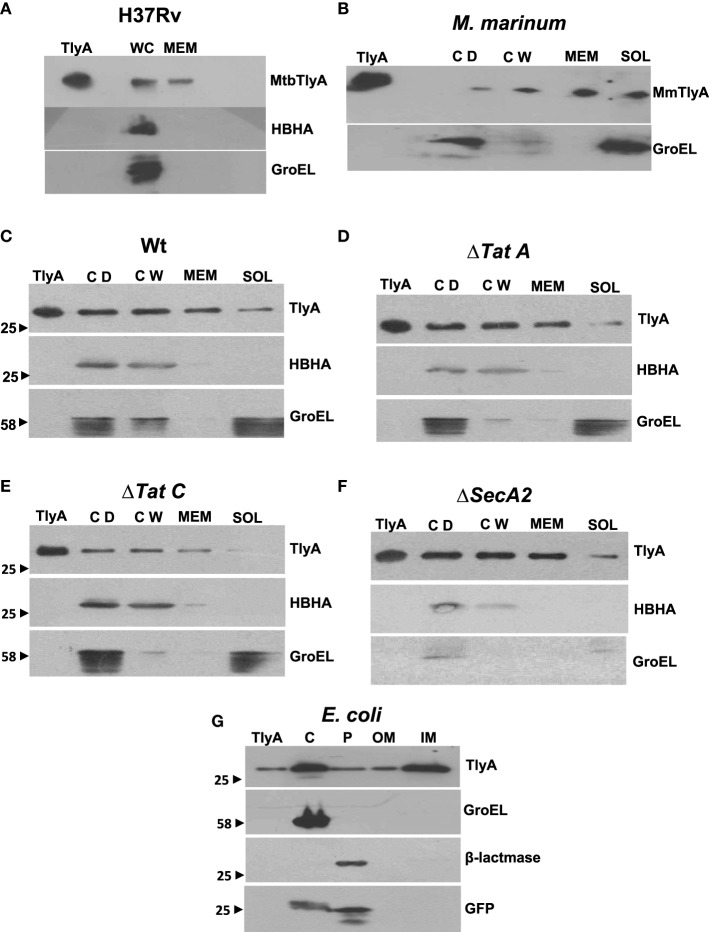
Figure 3.
Subcellular fractionation of M. tuberculosis (A) M. marinum (B), TlyA expressing M. smegmatis WT (C), ΔTatA (D), ΔTatC (E), ΔSecA2 (F), and E. coli/TlyA (G): The bacterial strains are indicated at the top of each panel. For all panels, the antibodies used for detection are indicated on the right side. Purified TlyA from E. coli was used as a marker for identification of TlyA band in all blots. The samples used for (A) were obtained from BEI resources. WC and MEM represent whole cell lysate and membrane fraction respectively. In (B–F), the lane markings CD, CW, MEM, and SOL respectively represent cell debris obtained after 3000 g, cell-wall after 27,000 g and membrane pellet fraction obtained after 100,000 g and soluble fraction of 100,000 g (supernatant). In panel G, the C, P, OM, and IM respectively represent the cytosolic, periplasmic, outer-membrane, and inner-membrane fractions. The panels are a representative of one of the three independent experiments.

