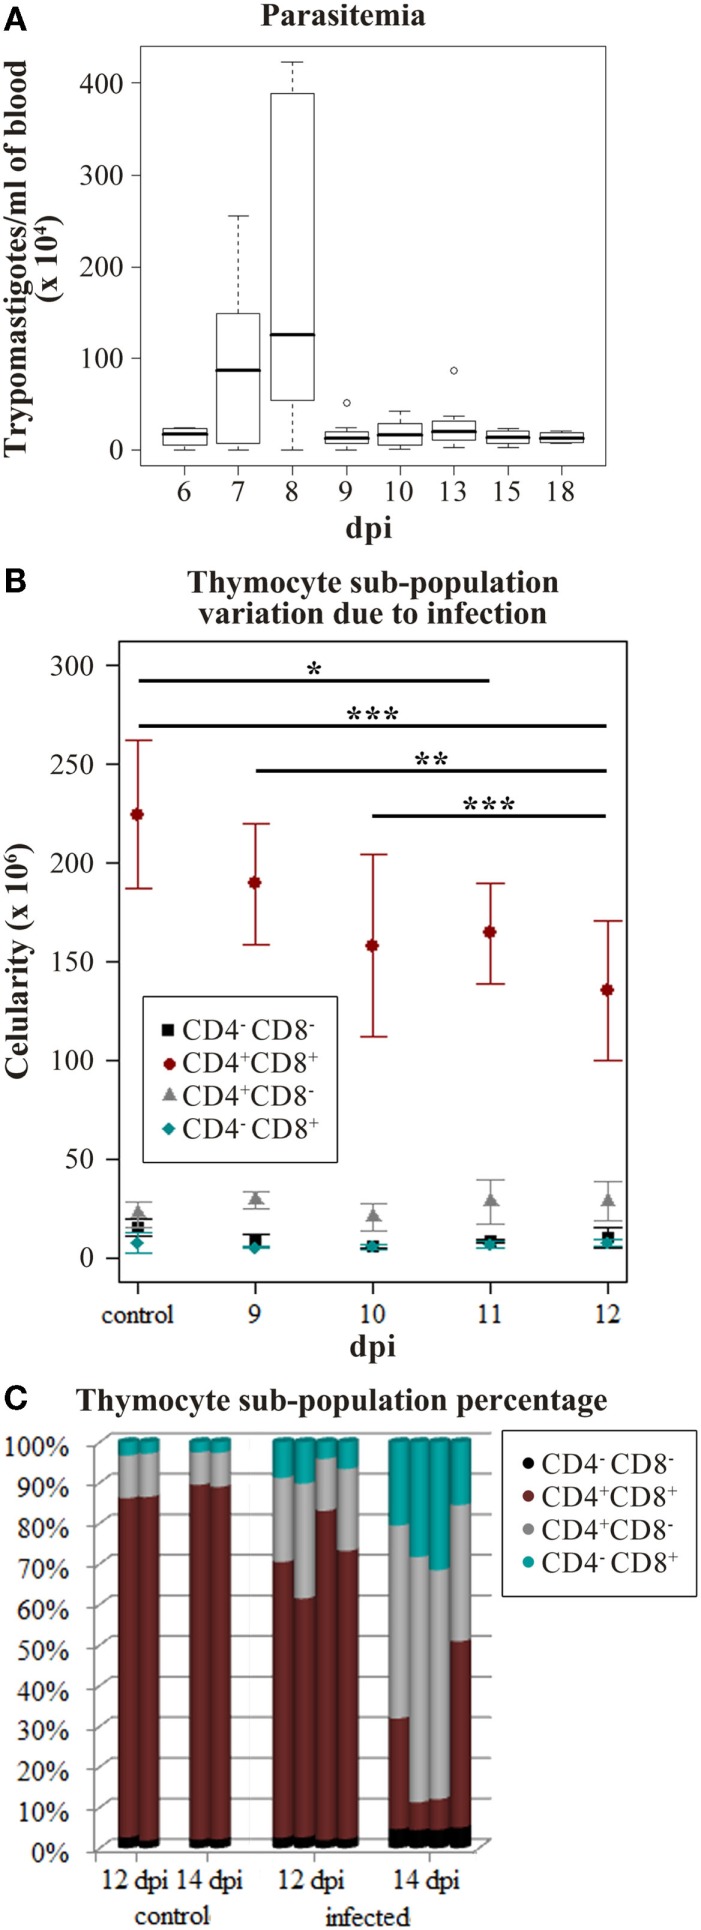
Figure 1.
Trypanosoma cruzi acute infection induces progressive thymic atrophy and CD4+CD8+ thymocyte loss. Nine C57BL/6 mice were infected with 1,000 metacyclic trypomastigotes and in the following 6–18 days the parasitemia was accessed to verify the infection progression. (A) The box plot shows the median amount of parasites per blood milliliter, upper and lower quartiles, maximum and minimum values (whiskers) excluding outliers (circles). Once the infection peak was identified (8 dpi), the thymocyte subpopulation variation in the following days was studied in order to identify when the CD4+CD8+ thymocyte loss starts. (B) The cytofluorometric profiles of thymocytes were obtained staining with anti-CD4 and anti-CD8. Thymocytes from three or four mice were submitted to FACS analysis on days 9–12 post-infection (dpi). The plots represent the mean number of cells ±SD in each day. The described decrease on CD4+CD8+ thymocyte subpopulation due to infection progression was confirmed (ANOVA p-value = 0.0002) and the Tukey’s honestly significant difference (HSD) post-test revealed significant differences in each dpi. (adjusted p-value ≤*0.05, **0.01, and ***0.001) (C) Thymocyte subpopulation percentages data derived from the cytofluorometric profiles show that by 14 dpi the thymic atrophy is reached. Each bar represents thymocytes from a single mouse.

