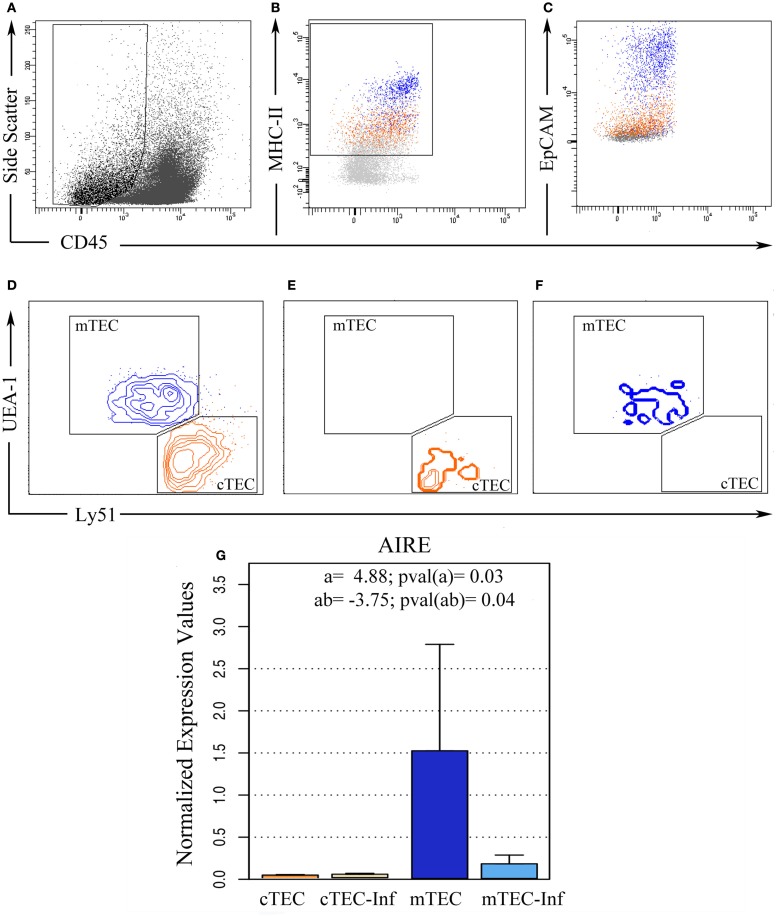
Figure 2.
Ex vivo thymic epithelial cell sorting. Five replicates of thymic cell pools from control and infected mice were sorted using flow cytometry in order to isolate TEC. (A) Initially, CD45− cells were selected based on size, (B) from this population, MHC-II positive cells were isolated after EpCAM confirmation (C). (D) Then, according to UEA-1 and Ly51 surface markers, these cells were distinguished between cortical TEC (cTEC, Ly51+, and UEA−, orange) and medullary TEC (mTEC, Ly51−, and UEA+, blue) phenotypes. Post-sorting analysis revealed 98% purity in cTEC (E) while 95% purity in mTEC (F). (G) After miRNA isolation, the remaining mRNA from three experimental pools allowed us to analyze AIRE gene expression, confirming if the sorted cells matched the correct expected TEC profile. The bar plot represents the average expression in each condition. “a” indicates the magnitude of the expression ratio (log−2) due to TEC phenotype, whereas a positive value shows a higher expression in mTEC. “ab” indicates the expression ratio magnitude (in log−2) as consequence of the combination between infection and cell type, whereas a negative value shows that the AIRE expression in infected mTEC is lower than in control mTEC.

