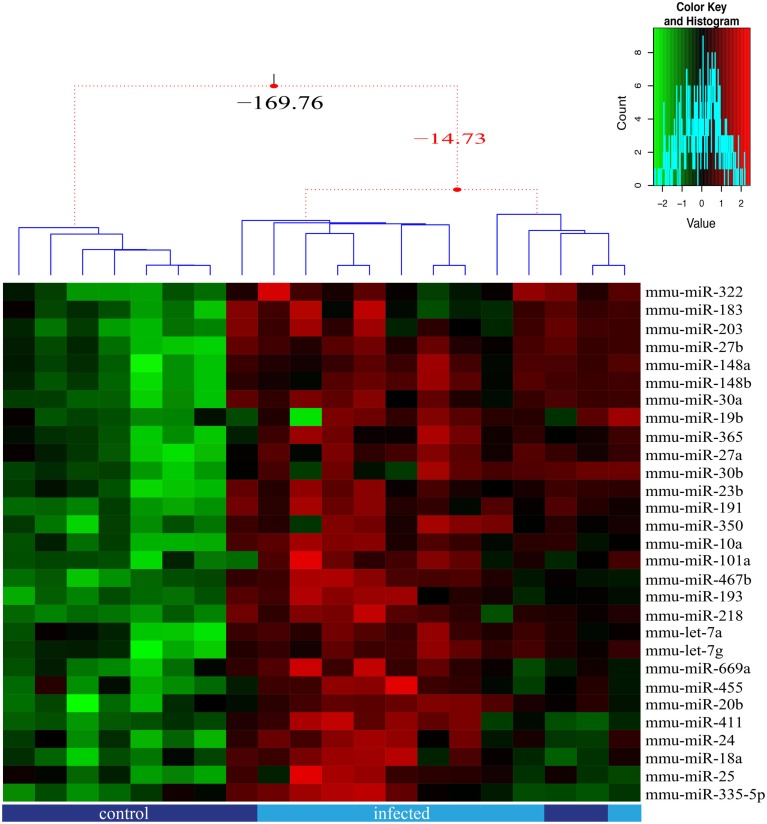
Figure 3.
miRNA relative expression in thymic epithelial cells from control and infected mice. The miRNA expression of 85 miRNAs was analyzed for each sorted TEC population, in five replicates, with samples from control (dark blue) and infected (light blue) mice being paired. We present the 29 miRNAs that were significant (adjusted p-value ≤0.05) differentially expressed due to infection and the samples clustered according to expression profile similarity. Three groups of samples were identified based on their expression profile, as illustrated by the dendrogram.

