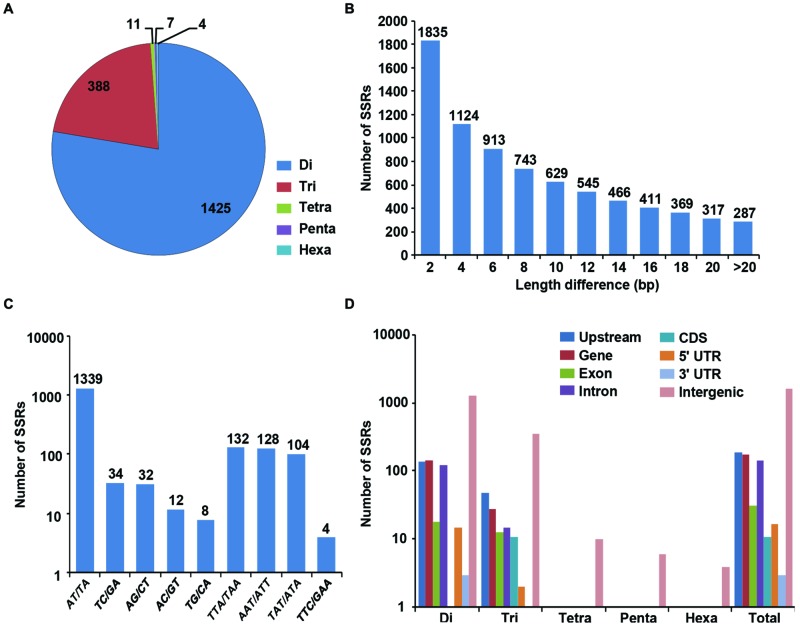
FIGURE 3.
Identification and analysis of polymorphic SSRs between desi and kabuli chickpea. (A) Distribution of polymorphic SSRs in different classes. (B) Number of SSRs with different motif length (2 to >20) differences. (C) Frequency of selected (most abundant) motifs in the polymorphic SSRs. (D) Distribution of polymorphic SSRs in in different genomic features (various gene components and intergenic regions).

