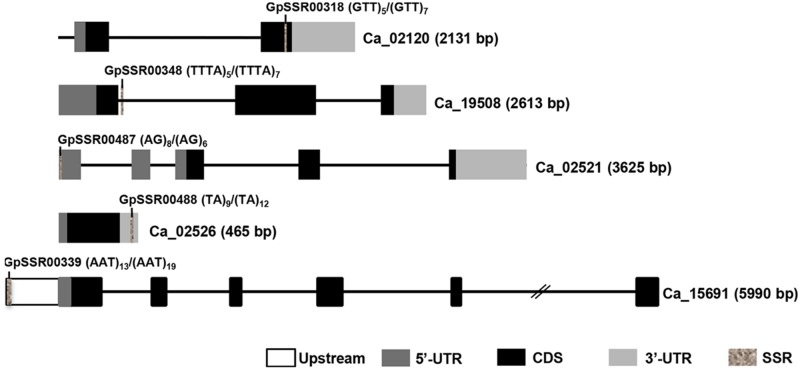
FIGURE 4.
Diagrammatic representation of polymorphic SSRs present in different components of chickpea genes. Introns and exons are represented by lines and boxes, respectively. Different components of exons are represented in different shaded boxes. The SSR motifs present in different genic regions have been highlighted in gray texture. The motif and its frequency in both chickpea (desi/kabuli) types are also given. Gene ID and length (bp) are given on right side.

