FIGURE 2.
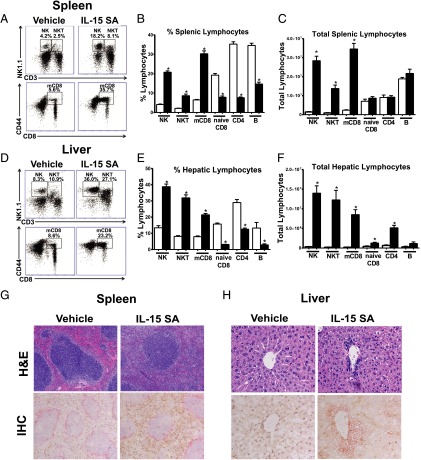
IL-15 SA treatment elicits expansion of NK, NKT, and memory phenotype CD8+ T lymphocytes in vivo. WT mice were treated with vehicle or 2 μg IL-15 SA for 4 d. At 24 h following the last treatment, splenic and liver NK (CD3−NK1.1+), NKT (CD3+NK1.1+), and memory CD8+ T (CD8+CD44high) lymphocyte numbers were determined using flow cytometry. Dot plots (A and D) are representative of results obtained from 9 to 15 mice/group. The bar graphs show the relative (B and E) and total numbers (C and F) of splenic and hepatic NK, NKT, and memory CD8 T as well as naive CD8+ T (CD8+CD44low), CD4 (CD4+), and B (CD3−CD19+) lymphocytes in IL-15 SA–treated (▪) and vehicle-treated groups (□). Data are representative of three to four separate experiments. n = 9–15 mice/group. *p < 0.05 compared with vehicle control. WT mice received daily administration of vehicle or 2 μg IL-15 SA for 4 d. Spleens (G) and livers (H) were then harvested on the next day for H&E (top panels, original magnifications ×100 in spleen sections and ×400 in liver sections) and IHC (bottom panels, original magnifications ×100 in spleen sections and ×400 in liver sections) staining. In IHC-stained sections of spleen, NK and NKT cells were identified by NKp46 expression and are stained brown; macrophages in the marginal zone stained with anti–MOMA-1 and are shown in pink. In IHC staining of liver sections, NK (NKp46 positive, brown), T (TCR-β positive, pink), and NKT (NKp46 and TCR-β double positive, brown and pink) cells are shown, respectively. Olympus BX43 microscope and Olympus digital color camera DP73 were used for acquisition of the images.

