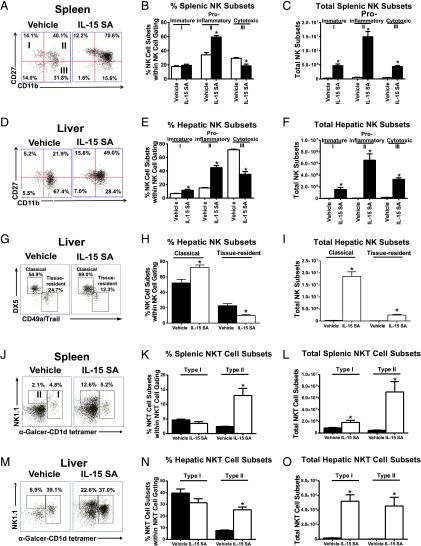
FIGURE 3.
Characterization of NK and NKT subsets following IL-15 SA treatment. Upon treatment with vehicle or 2 μg IL-15 SA for 4 d, spleens and livers were harvested on day 5. In the representative histograms, splenic (A) and hepatic (D) NK cells are divided into four subpopulations based on CD11b and CD27 expression, namely precursor (CD11blowCD27low), immature (I, CD11blowCD27high), mature proinflammatory (II, CD11bhighCD27high), and mature cytotoxic (III, CD11bhighCD27low) NK cells. The percentage and total numbers of NK cell subsets in spleen and liver are shown graphically in (B), (C), (E), and (F). n = 6–10 mice/group. In liver, NK cells are specifically classified into two separate subsets, namely classical (NK1.1+DX5+CD3−CD49a−Trail−) NK cells that resemble those in spleen and tissue-resident (NK1.1+DX5−CD3−CD49a+/Trail+) NK cells that mediate Ag-specific memory-like responses. Of note, liver tissue-resident DX5−CD49a+ NK cells express high levels of Trail, whereas classical DX5+CD49a− NK cells exhibit minimal expression of Trail. Thus, a combination of anti-CD49a and anti-Trail Abs conjugated with the same fluorochrome was used to distinguish classical (double negative) and tissue-resident NK cells (CD49a or Trail positive). The representative dot plot, percentage, and total numbers of NK cell subsets in liver are shown in (G)–(I). n = 5 mice/group. In representative dot plots, type I (CD3+NK1.1+/−α-Galcer-CD1d tetramer+) and type II NKT subsets (CD3+NK1.1+α-Galcer-CD1d tetramer−) in spleen (J) and liver (M) are shown in vehicle- and IL-15 SA–treated groups. The percentage (K and N) and total numbers (L and O) of each subset are shown in bar graphs. Data are representative of two to three separate experiments. *p < 0.05 compared with vehicle control.

