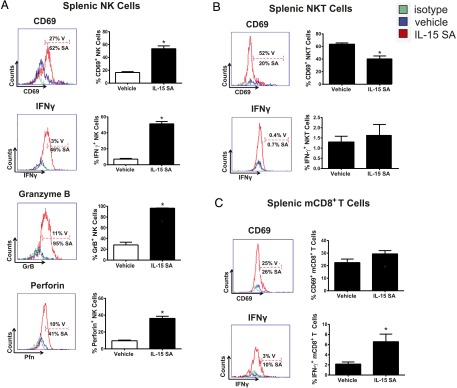
FIGURE 4.

Characterization of NK, NKT and memory CD8+ T cell activation following IL-15 SA treatment. Representative histograms show the percentage of splenic NK cells (A) expressing CD69 on the surface as well as production of intracellular IFN-γ, granzyme B, and perforin from vehicle (blue)- and IL-15 SA (red)–treated mice. The gates were drawn based on isotype control staining (green). The bar graphs shown on the right quantify representative data with 9–10 mice per group. The activation status of NKT and memory CD8+ T cell upon IL-15 SA treatment was also analyzed. The representative histograms show expression of CD69 by splenic NKT (CD3+NK1.1+) (B) and mCD8+ (CD8+CD44high) T cells (C) from vehicle (blue)- and IL-15 SA (red)–treated mice. IFN-γ expression by NKT and mCD8+ T cells is also shown. Specific isotype staining (green) was determined as control. The percentage of CD69+ and IFN-γ+ cells in each group is shown in the figure. The bar graphs shown on the right quantify representative data with 8–10 mice/group. Data are representative of two to three separate experiments. *p < 0.05 compared with vehicle. SA, IL-15 SA; V, vehicle.
