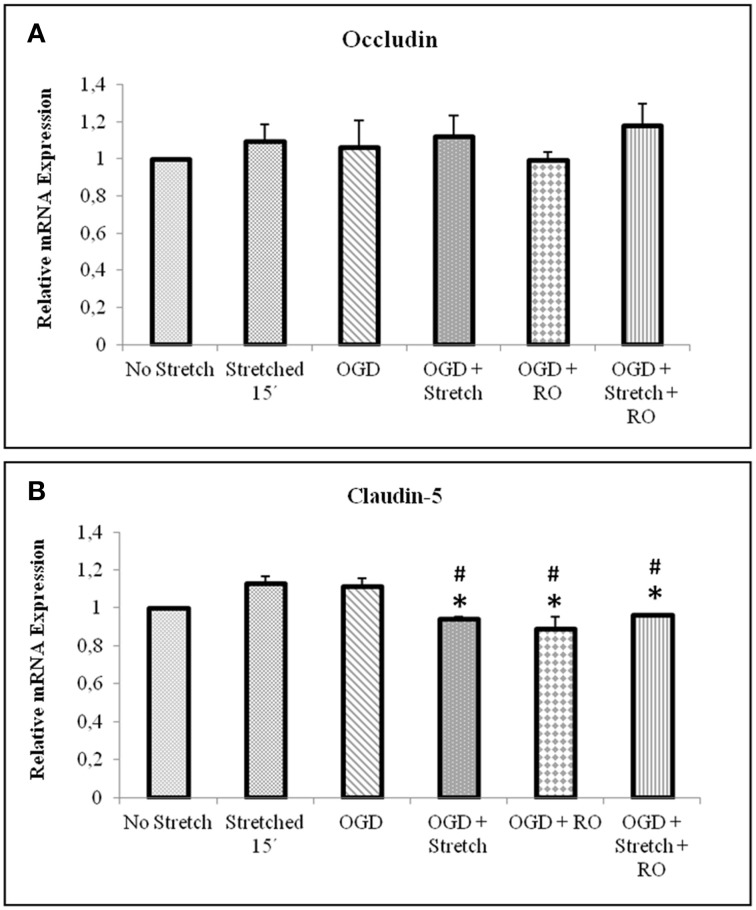
Figure 7.
qPCR analysis of tight junctions mRNA expression in cEND cells. Values are the means (± SEM) of 6 independent experiments normalized to β-actin. Statistical significance was evaluated using One-Way ANOVA (Holm-Sidak method), *, # p < 0.005 compared to stretched 15′ and OGD, respectively. OGD, oxygen glucose deprivation; RO, re-oxygenation.

