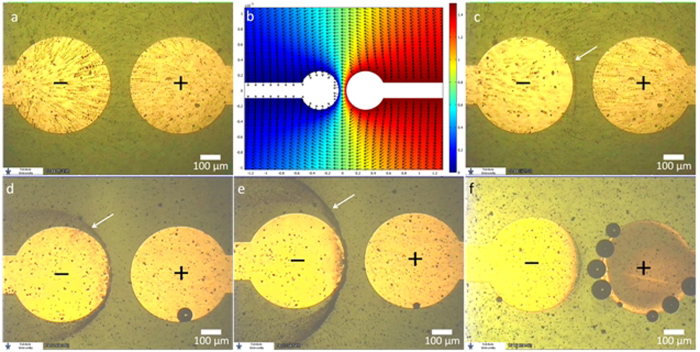
Figure 2.
(a) Image comprised of 8 superimposed video frames showing electrokinetic particle trajectories between the positive pole (right) and negative pole (left), recorded at 1.5 V. (b) The simulated 2D potential map at an arbitrary voltage of 1.5 V in vacuum. The direction of electric field norm is indicated by the arrows. (c) Image comprised of 8 superimposed video frames showing the beginning of particle patterning (indicated by the arrow) in the inter-electrode region. (d,e) The stabilized patterns at applied voltages of 1.5 V and 2.0 V respectively. (f) Eectrochemical gold stripping and Cl2 gas bubbles observed in a dispersion droplet containing NaCl, at an applied voltage of 2.3 V. (See text for details).

