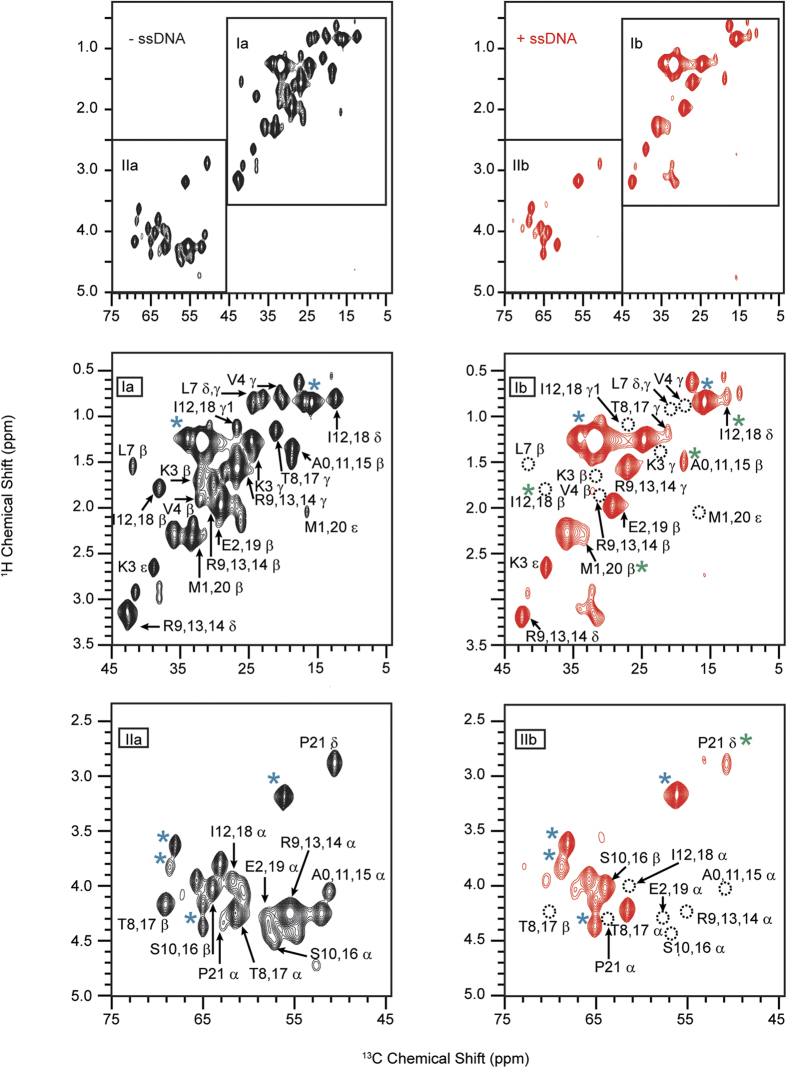
Figure 5. Mapping of PLN residues involved in ssDNA binding.
[1H, 13C] RINEPT spectra of PLN in DMPC lipid vesicles in the absence (black) and presence (red) of ssDNA (80mer). Blue asterisks indicate lipid signals; green asterisks indicate a change in peak shape. Dotted circles indicate missing peaks.

