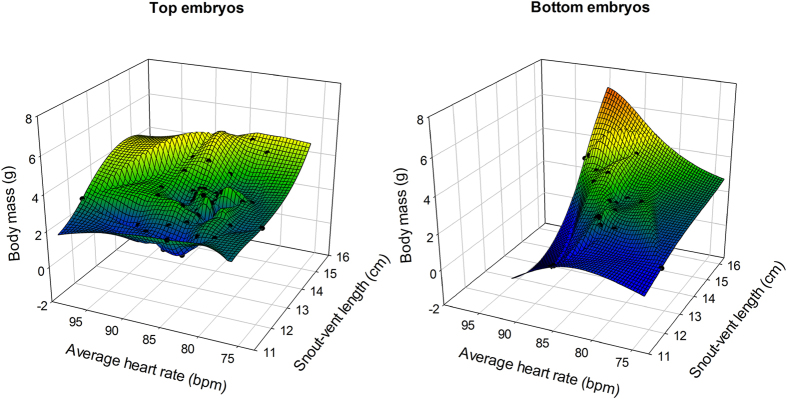
Figure 5. 3D plot of mean embryo heart rates recorded throughout incubation plotted against hatchling snout-vent length against hatchling body mass in top (left panel) and bottom (right panel) embryos.

Hatchling snout-vent length and body mass were largely explained and positively correlated with average embryo heart rates during incubation in bottom embryos. Such relationship however, was much less pronounced in eggs where the embryos were located at the top of the egg (see text for statistical results).
