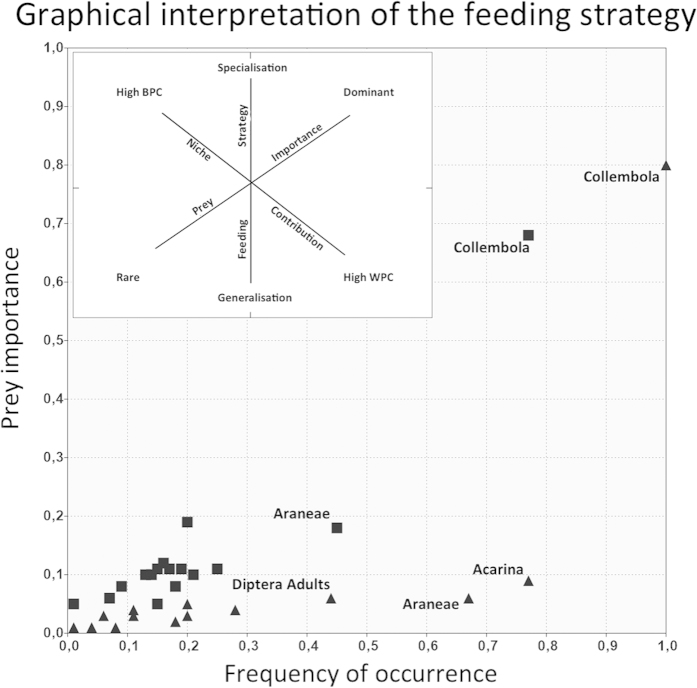
Figure 1. Costello’s modified graphical interpretation of the foraging strategy (Amundsen et al., 1992).
Autumn data are represented by squares, while spring data are represented by triangles. Labels of prey categories with both values of Prey importance and Frequency of occurrence lower than 0.30 are not shown.

