Figure 2.

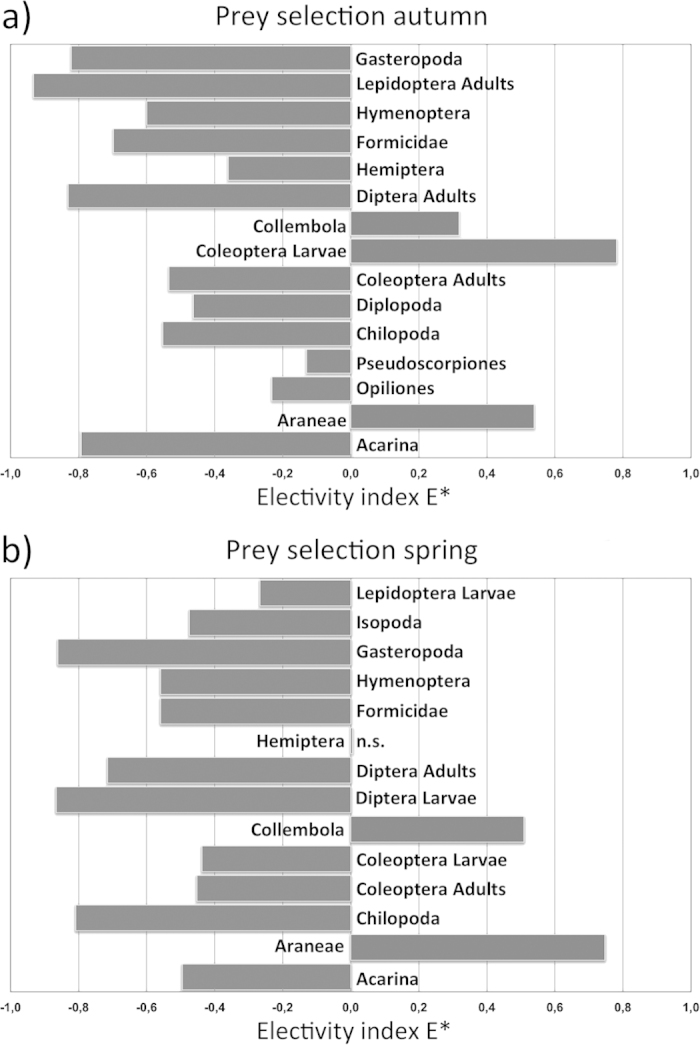
Vanderploeg and Scavia’s (1979) electivity index E* for the most representative prey categories in autumn (a) and spring (b). n.s. = not significant values.

Vanderploeg and Scavia’s (1979) electivity index E* for the most representative prey categories in autumn (a) and spring (b). n.s. = not significant values.