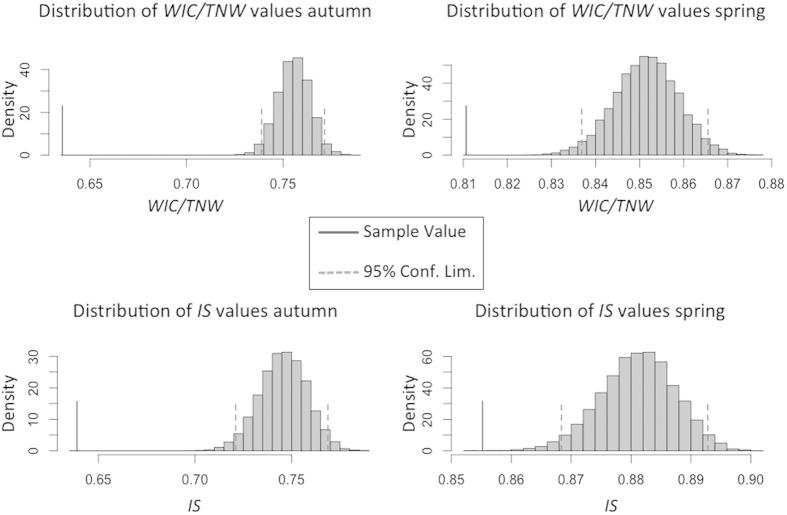
Figure 3. Histograms of distributions of within-individual component/trophic niche width (WIC/TNW) ratio and individual specialization (IS) indices obtained by Monte Carlo resampling procedure, both for autumn and spring data.
Vertical broken lines show the 95% confidence limits of the simulated distribution, while the vertical solid line shows the actual index value for the original data.

