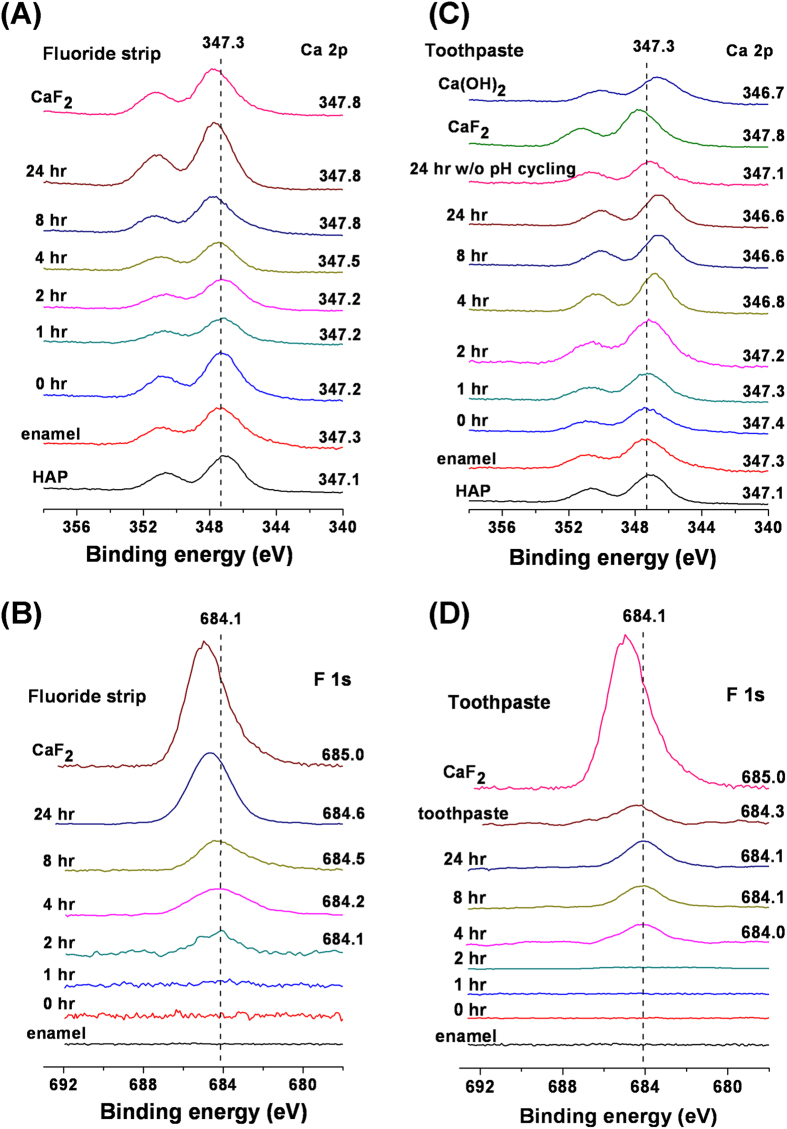
Figure 2.
(A,C) Ca 2p and (B,D) F 1s XPS spectra taken from the specimen surfaces following exposure to (A,B) the fluoride strip and (C,D) toothpaste for the specified periods of time and then pH cycling. Their related Ca 2p and F 1s spectra taken from HAP, the pristine enamel, Ca(OH)2, and CaF2 are included in respective plots for comparison.

