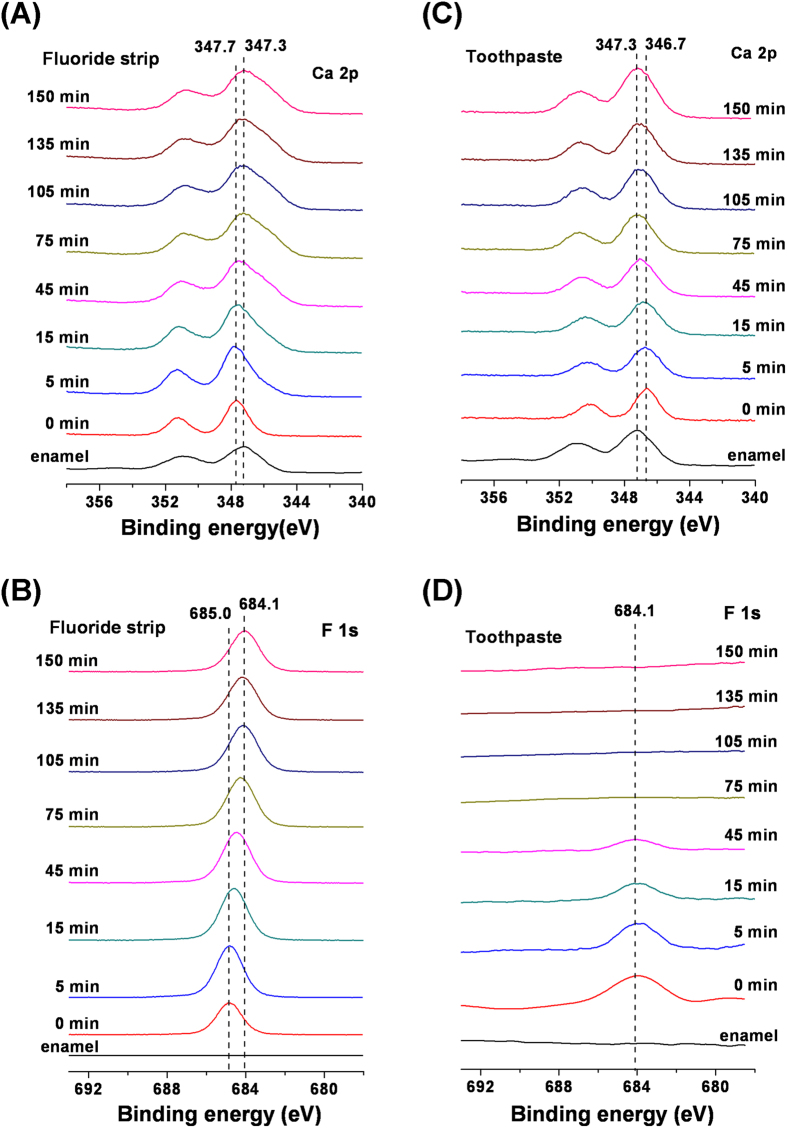
Figure 3.
(A,C) Ca 2p and (B,D) F 1s XPS spectra taken from the 24-hr, (A,B) fluoride-strip- and (C,D) toothpaste-treated specimen surfaces following ion etching for the specified periods of time. Their related Ca 2p and F 1s spectra taken from the pristine enamel are included in respective plots for comparison.

