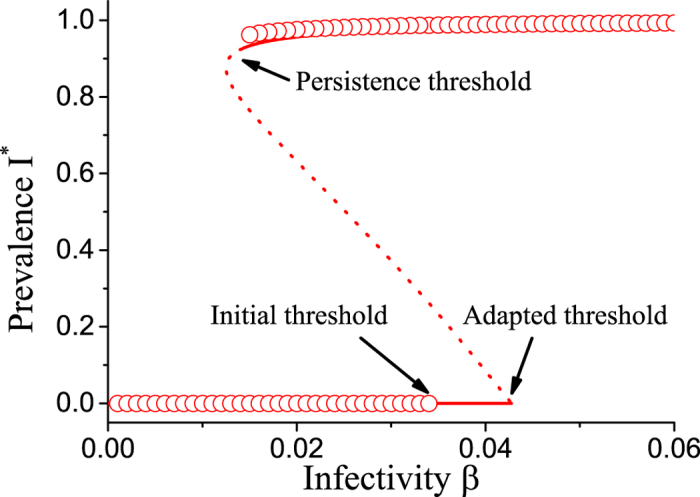
Figure 1. Bifurcation diagram of the adaptive heterogeneous SIS model.

Show is the stationary level of disease prevalence I* as a function of infectivity β. When the infectivitiy is decreased the endemic state vanishes in a saddle node bifurcation (‘Persistence threshold’). The disease free state can be invaded by the epidemic, if the infectivity surpasses a point where a transcritical bifurcation occurs (‘Invasion threshold’). Agent-based simulation (circles) and equation-based continuation (lines) provide consistent results on the persistence threshold, but predict different invasion thresholds. This discrepancy appears due to a projection effect, because the state where the disease is extinct is not uniquely defined (see text). In addition to stable solution branches (solid) the continuation also reveals an unstable solution branch (dotted). Parameters: ψa = 0.65, ψb = 0.05, pa = 0.75, ω = 0.2, μ = 0.002, N = 105, K = 106.
