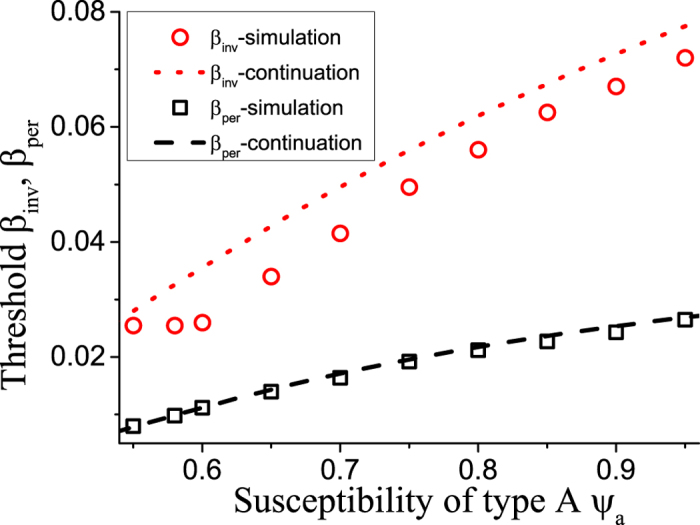
Figure 2. Comparison of thresholds.

The plot shows a very good agreement agreement between equation-based continuation (lines) and agent-based simulations (symbols) for the persistence thresholds βper (box, dashed). However, a notable difference exists for the invasion thresholds βinv (circle, dotted). Parameters: ψb = 0.05, ω = 0.2, μ = 0.002, N = 105, K = 106.
