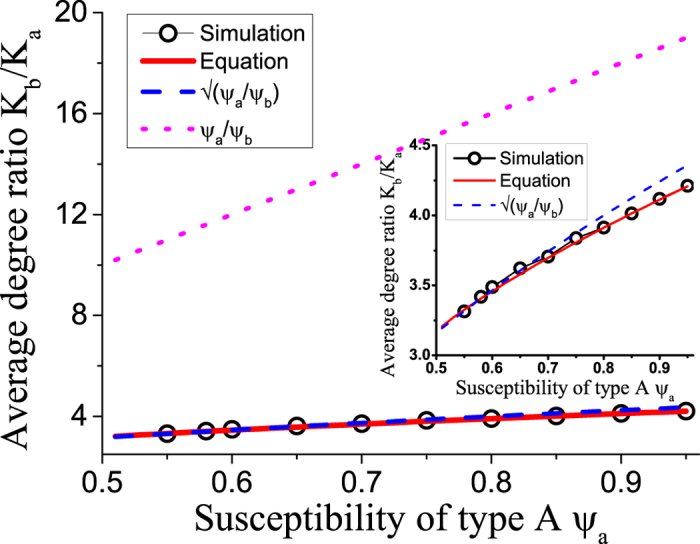
Figure 3. Network heterogeneity in the adapted state, indicated by the degree ratio kb/ka.

The dependence of the degree ratio in agent-based simulations (black circles) closely follows the prediction from integration of the ODE model (solid red line), a very good approximation is also provided by the relationship  (blue dashed line), whereas the naive expectation kb/ka = ψa/ψb (pink dotted line) overestimates the network heterogeneity significantly. Contrary to expectations the networks following the naive solution (the most heterogeneous case), would be maximally stable against disease invasion. Parameters: ψb = 0.05, ω = 0.2, μ = 0.002, N = 105, K = 106. Inset: the magnification of the superimposed part of the main figure.
