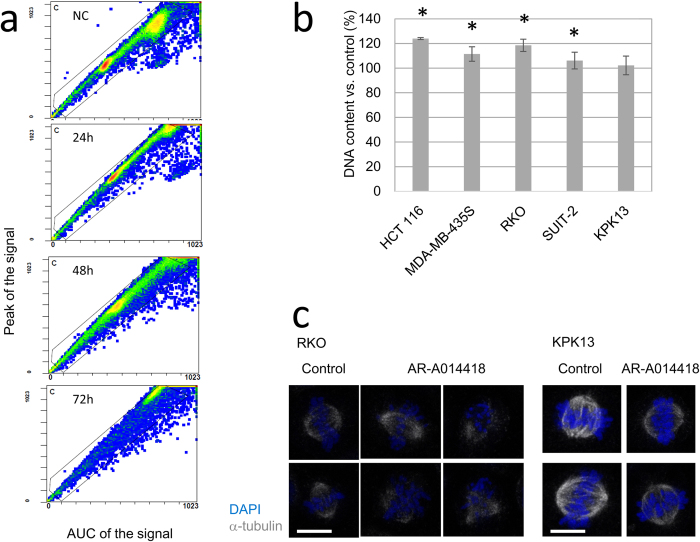
Figure 4. Chromosomal instability induced by AR-A0114418.
(a) Representative plots of cellular DNA contents in RKO cells analysed by flow cytometry. Cells were analysed at the indicated times after adding 20 μM AR-A014418. Signal peaks indicate maximum DNA densities in each cell. Areas under the curve (AUC) of the signal indicate the total DNA contents in each cell. The ratio of the signal peak to AUC of the signal is an indicator of particle aggregation. When cells make aggregates, the AUC of the signal increases whereas the signal peak does not. (b) Increases in DNA contents after treatment with AR-A014418. Peak signal intensity of G0/G1 phase in DNA histogram was measured as a DNA content after 120 h treatment with 20 μM AR-A0114418. Average of three independent experiments is shown. Error bars indicate 95% CIs (*p < 0.05). (c) Mitotic spindle morphology after AR-A014418. Cells were treated with 20 μM AR-A014418 for 48 h and then stained. (Scale bar = 10 μm).

