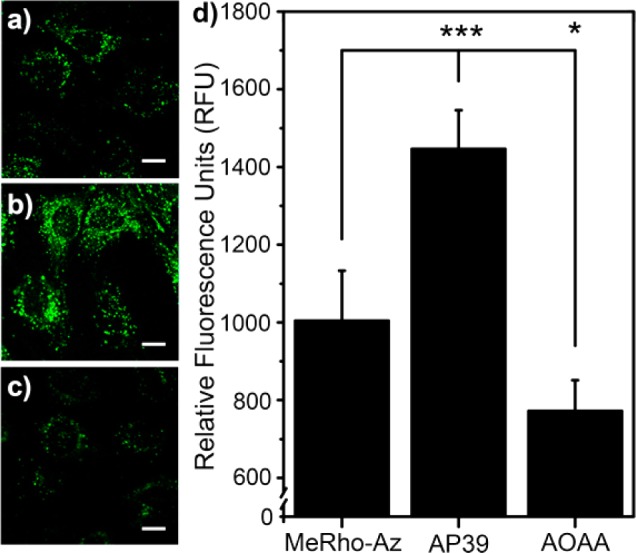
Figure 4.

Fluorescence imaging of H2S in C6 cells. Cells were imaged after incubation with 5 μM MeRho-Az for 45 min after pretreatment with (a) no pretreatment, (b) 100 nM AP39 for 60 min, or (c) 20 μM AOAA for 45 min. Scale bars = 5 μm. (d) Quantified cellular fluorescence after reaction of MeRho-Az with endogenous H2S (MeRho-Az, N = 24 cells), after addition of exogenous H2S (AP39, N = 24 cells), and after inhibition of enzymatic H2S production (AOAA, N = 24 cells).
