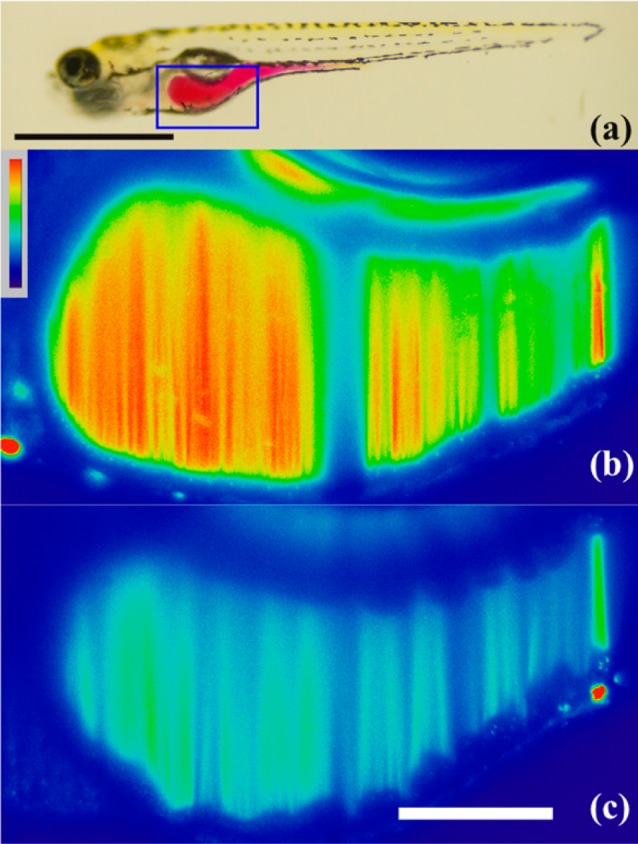
Figure 5.

2D slices of LSFM images of live zebrafish 60 min after gavage. (a) Larval zebrafish (7 dpf) gavaged with phenol red to highlight the intestine (scale bar = 1 mm). The boxed region corresponds to the intestinal bulb expanded below in (b,c). Zebrafish gavaged with (b) 5 μM MeRho-Az + 250 μM DATS + 250 μM GSH or (c) 5 μM MeRho-Az. Scale bar in (b) and (c) = 10 μm.
