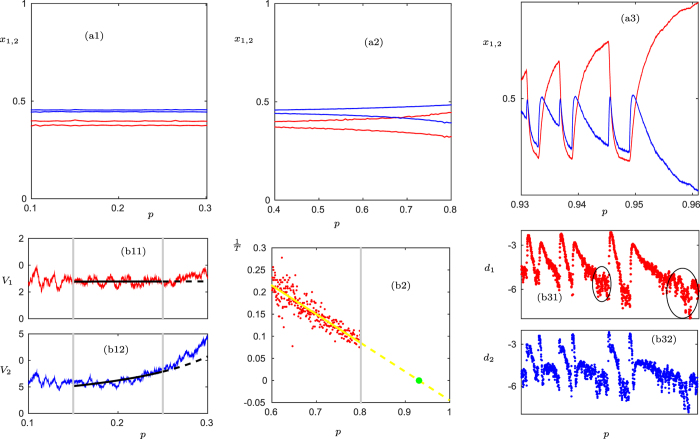
Figure 2. Critical transitions for an evolutionary game.
(a) Time series for the density of cooperators x1 (red) and the density of defectors x2 (blue); note that we slowly increase the parameter p in time at a constant rate, i.e., p can be viewed as a time variable. In (a1)–(a2) the minima and maxima of a moving average are shown whereas (a3) shows the actual time series. The vertical dashed curve (thin black) in (a1) indicates the theoretically-predicted transition to oscillations; see (Supplementary Information, Section 3). In (b1) the variances for x1,2 are calculated using a moving window technique up to the gray vertical lines; note that the scaling of the V1,2-axis is 10−5. Observe that x1 does not show a clear scaling law while the scaling of x2 can be used for predicting the transition from steady state to oscillations using classical variance-based warning signs. The predicted transition point from extrapolating the increasing variance scaling law11 is marked as vertical dashed line (black) in (a2); note that there is a delay in the Hopf bifurcation point so the predicted critical transition to matches, from a practical viewpoint, the data better than the second-order moment closure theory22. In (b2) the period T of the oscillation is measured and 1/T is linearly interpolated to approximate the period blow-up5 point (yellow). This is used to predict the transition point (green) from a periodic to a saddle-type/homoclinic regime; note that this period blow-up is not the saddle-mechanism we focus on in this paper but another new warning sign we just note as an interesting related result. The predicted transition is marked by the dashed vertical line (green) in (a3). Then we also show the logarithmic distance reduction measured from (a3) in (b3). The ellipses in (b31) indicate the regime where the decay-scaling for the saddle-approach breaks down. Note that the ellipses are there to guide the eye. If one would want to give an explicit warning sign, a threshold for λu has to be specified, which is not done in this qualitative example. A detailed quantitative analysis of thresholds is carried out for a data set below using ROC analysis. Here we just want to point out the existence of saddles and the qualitative change in the distance reduction near the saddle, i.e. the parts (a3) and (b3) illustrate the main ideas for saddle-escape warning signs.

