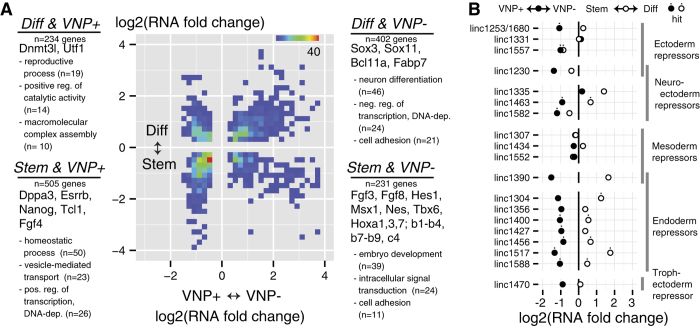
Figure 3. Distribution of Joint Hits and Differential Expression of lincRNA.
(A) Joint distribution of fold changes for genes that turned up as 10% FDR hits for differential expression in heterogeneity (Nanog:VNP(+) vs Nanog:VNP(−)) and differentiation (Stem vs Diff). Text annotations for each quadrant note some genes found in it, as well as the top 3 GO terms and number of genes falling in them by the “greedy” method. (B) Differential expression analysis for lincRNA identified by22 as repressors of certain lineage programs in mouse ES-cells.

