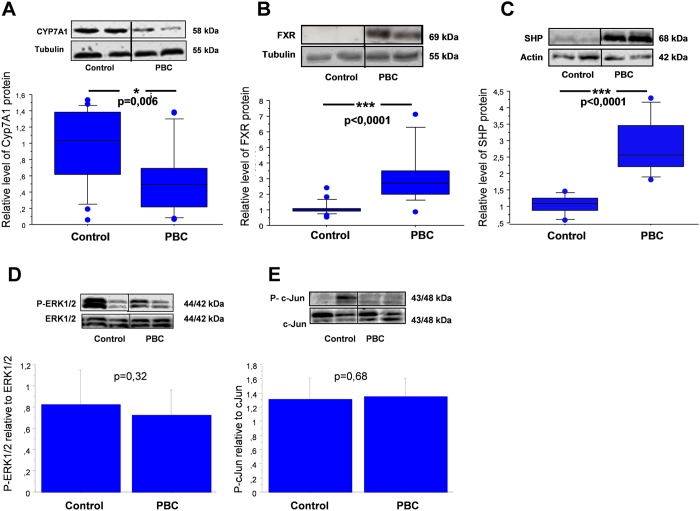
Figure 4. Expression of CYP7A1, FXR, SHP, phosphorylated ERK1/2 and phosphorylated c-Jun proteins in liver tissue of cirrhotic patients with PBC and controls.
Changes in (A) CYP7A1, (B) FXR and (C) SHP levels were determined by densitometry analyses after normalization to α/β tubulin or β-actin as a control for loading. Data presented as the box-and-whisker plot with median value (middle line). Phosphorylated (D) P-ERK1/2 and (E) P-c-Jun bands were quantified by densitometry and normalized to the density of the total ERK1/2 and c-Jun, respectively. Bars indicate the mean ± SEM.

