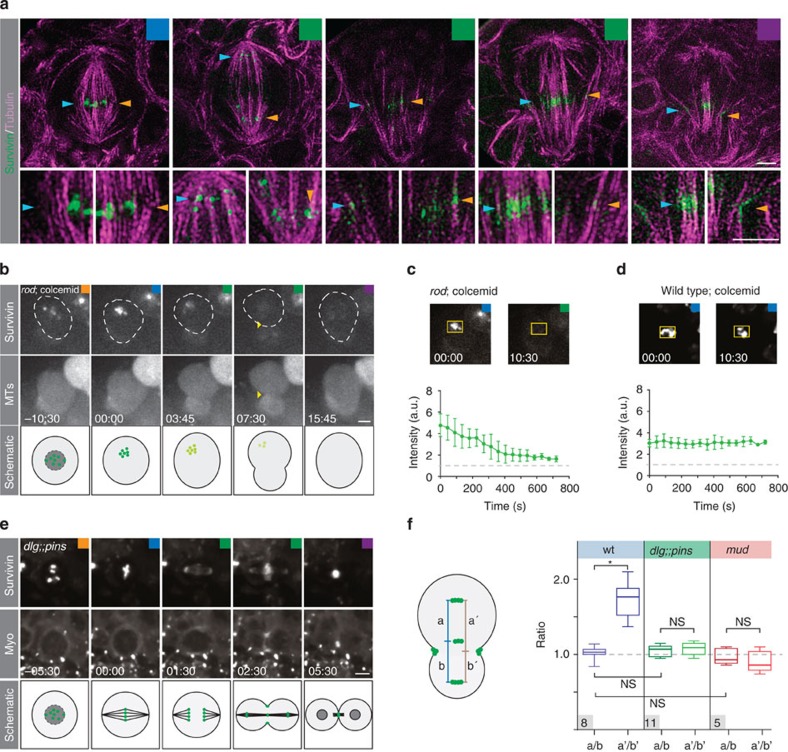
Figure 3. Survivin’s relocalization depends on the spindle and anaphase entry.
(a) 3D-SIM images of third instar larval brain wild-type neuroblasts, expressing Survivin::GFP (green) and stained with α-Tubulin (magenta). High-magnification pictures of areas of interest (blue and orange arrows) are shown below the overview pictures. Coloured arrowheads highlight Survivin clusters in association with microtubules. (b) Image sequence of a representative rodH4.8 mutant neuroblast treated with colcemid, imaged with Survivin::GFP (top row) and the spindle marker mCherry::Jupiter (middle row). Schematic below; green dots represent Survivin molecules fading away. (c) Intensity measurements of Survivin::GFP in rodH4.8 and (d) wild-type neuroblasts treated with colcemid. The graph shows average intensity. Error bars correspond to s.d. (wt; n=10, rod and colcemid; n=8). (e) Image sequence of a representative dlgm52;;pinsP89 mutant neuroblast expressing Survivin::GFP (top row) and Sqh::mCherry (Myo; second row), dividing symmetrically. (f) Measured distance ratios between the indicated Survivin pools in wild-type, dlgm52;;pinsP89 and mud4 mutant neuroblasts. Number of scored cells are indicated in the grey box. Asterisk (*) denotes statistical significance. P=0.000023 (two-sample unequal variance t-test). NS, not significant; P>0.01 (based on two-sample equal or unequal variance t-test). Time in min:s; scale bar, 2 μm in panel (a) and 5 μm in all subsequent panels. wt, wild type.

