
Figure 2.
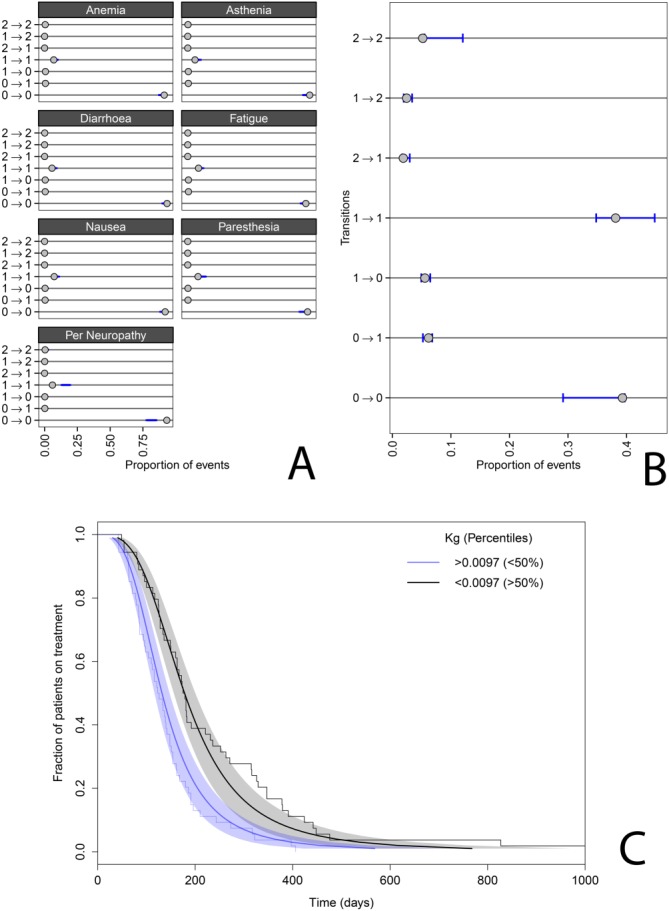
(A) Model predictions (95% prediction intervals) and observed incidence of transitions for the Markov-transition models for the other adverse events model and (B) ECOG performance score model. (C) Dropout model simulated median (thick solid lines) and 95% confidence intervals (areas) and observed (thin solid lines), stratified by patients above (blue) and below (gray) the median estimate for the PSA growth rate (KG).