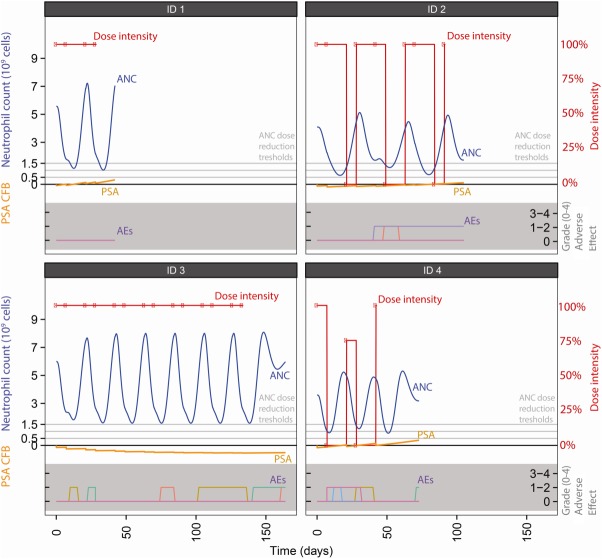
Figure 3.
Typical simulated time courses for dose reductions (red symbols and lines), neutrophils (dashed line), PSA (dotted orange line) and other adverse events (colored lines in bottom gray area) in four simulated patients. Neutropenia dose reductions thresholds are at 1.5*109 (predose threshold), 1.0*109 (grade 3), and 0.5*109 (grade 4) cells/L.

