Figure 3.
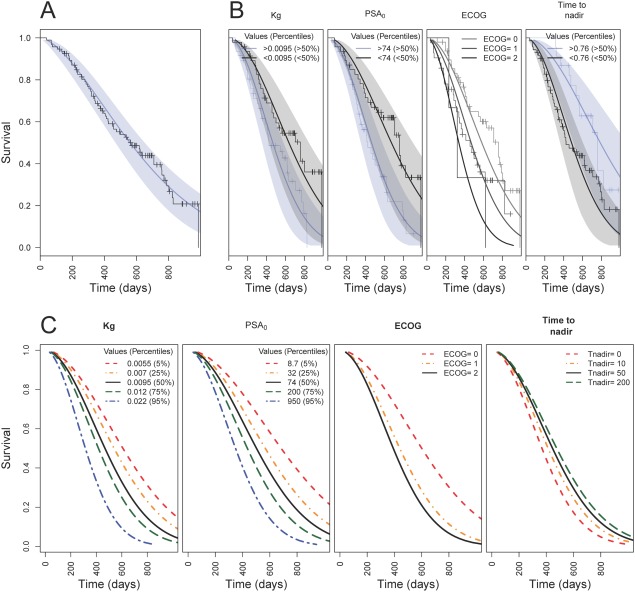
Observed and predicted survival vs. time (days). (a) Observed (Kaplan-Meier), median predicted (blue line) with associated 95% confidence interval (blue area). (b) Observed (Kaplan-Meier) and model predictions (median and 95% prediction interval) stratified below and above the 50th percentile for covariates (ECOG, time to PSA nadir [days], KG [days−1], PSA0 [ng/ml]) in the final covariate survival, or stratified for different ECOG scores. C: Model predictions for different values of the covariates in the final survival model.

