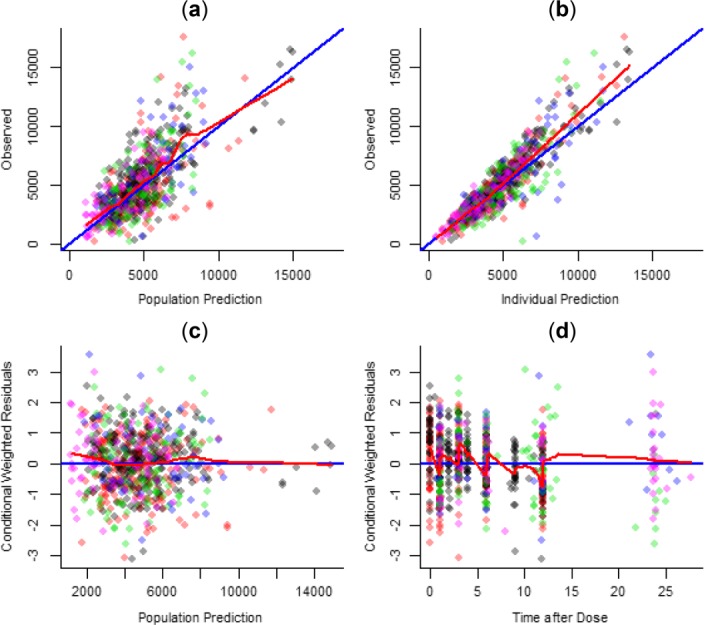
Figure 1.

Basic goodness-of-fit plots for the model adjustment. (a) Observed vs. population prediction; (b) observed vs. individual prediction; (c) conditional weighted residuals vs. population prediction; (d) conditional weighted residuals vs. time after dose. Black dots represent adult DUET data, red dots DELPHI data, green dots ARIEL data, blue dots ARIEL QD substudy data, and pink dots DIONE data. Opacity is applied so that if points overlap, the overlapping area is darker.
