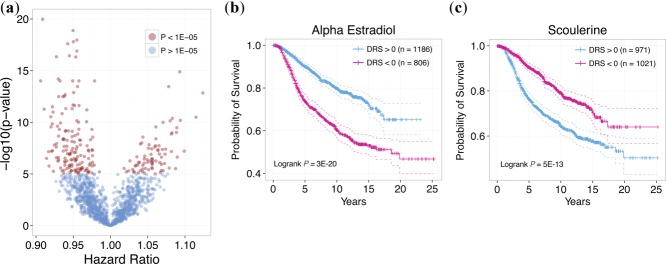
Figure 2.

Output of IDEA. (a) Distribution of hazard ratios and P-values for all drugs. Each point corresponds to a drug, with red points corresponding to drugs with P < 1E-5 and blue points corresponding to drugs with P > 1E-5. Drugs with HR <1 indicates that survival is correlated with increased similarity of the DTP with breast cancer GEPs. Drugs with HR >1 indicates that survival is anticorrelated with increased similarity of the DTP with breast cancer GEPs. (b) Kaplan-Meier plot of patients with DRS >0 and DRS <0 for alpha estradiol. Patients with high DRS exhibit significantly more favorable prognosis than patients with low DRS (P = 3E-20, Logrank test). (c) Kaplan-Meier plot of patients with DRS >0 and DRS <0 for scoulerine. Patients with low DRS exhibit significantly more favorable prognosis than patients with high DRS (P = 5E-13, Logrank test).
